With every advancement in science and technology, there have been curious minds trying to apply the knowledge learnt to the human body; attempting to understand the hidden secrets of nature. Learn the fascinating facts and instruments discovered and invented by these enquiring minds. The current chapters are:
With every advancement in science and technology, there have been curious minds trying to apply the knowledge learnt to the human body; attempting to understand the hidden secrets of nature. The following is a brief timeline of these significant milestones, that have helped shape medical physics that we know and love today:
| Year | Innovator | Milestone |
|---|---|---|
| 1600 | Egyptians | The treatment of abscesses using a fire drill, is described in the Edwin Smith Surgical Papyrus. |
| 480 | Hippocrates | Wrote about the use of thermography. In his day, mud was spread over the patient’s affected areas. The parts that dried first were thought to indicate underlying organ pathology. |
| Year | Innovator | Milestone |
|---|---|---|
| 965 | Alhazen (Ibn al-Haytham) | Specialised on optics, especially the physics of vision and helped to greatly move the scientific movement forward at the time. |
| 1508 | Leonardo da Vinci | Discovered the principle of the contact lens. One of the world’s first medical physicists, he was fascinated by biomechanics. |
| 1611 | Santorio Santorius | Created the first clinical thermometer. |
| 1673 | Antonie van Leeuwenhoek | Invented the microscope. |
| 1680 | Giovanni Borelli | Related animals to machines and used mathematics to prove his theories. He is regarded as one of the founding fathers of biomechanics. |
| 1780 | Luigi Galvani | Showed that a frog’s legs twitch when placed in a circuit with 2 dissimilar tools. He realised that this was a form of ‘animal electricity’ from the muscle. |
| 1799 | Alessandro Volta | Invented the battery and founded the basis of electrochemistry. He discovered this by taking Luigi’s work one step forward by demonstrating that a brine-soaked cloth could be used instead of a frog’s legs. |
| 1836 | René Laennac | Created the stethoscope. |
| 1835 | Michael Faraday | Contributed significantly to the field of electromagnetism and started to lecture physics at St George’s university. |
| 1850 | Hermann von Helmholtz | Inventor of the ophthalmoscope, to inspect the retina and other parts of the eye. |
| 1890 | Professor Reinold | In this decade physics became compulsory in UK undergraduate medicine. Academic physics departments were established in medical schools across the country with, Prof. Reinold being the first lecturer of Physics at Guy’s Hospital. |
| 1895 | Wilhelm Roentgen | Discovery of x-rays and circulates famous image of wife’s hand. |
| 1896 | Henri Becquerel | Discovered radioactivity but also experiences an adverse effect two years later where he receive’s a burn from a piece of radium in his pocket, taking several months to heal. |
| 1896 | Thomas Edison | Reports eye injuries from x-rays with further symptom reports from others later on in the year including hair loss, reddened skin, skin sloughing off, and lesions. |
| 1898 | Wilhelm Roentgen | Committee of the Roentgen Society on x-ray dosage is established due to the adverse effects and injuries caused by x-rays. |
| 1901 | Henri-Alexandre Danlos | Treats lupus using radium brachytherapy, which involves implanting radioactive materials directly into the affected tissue |
| 1903 | George H. Stover | First radium treatment of skin cancer, he experimented on himself but sadly died early due to excessive radiation exposure. |
| 1904 | Clarence Dally | First person to have reportedly died as a result of x-ray exposure. |
| 1910 | - | Treatment of ringworm arises, extending its applications to the treatment of acne, skin cancers and fungal infections. |
| 1913 | - | Baltimore introduces radium teletherapy, now the most common form of radiotherapy where ionising radiation is pointed at the affected area of interest. |
| 1919 | Sidney Russ | Builds a teletherapy machine at Middlesex Hospital using 2.5g radium left over from the great war. It has deeper penetration than x-rays and a better depth dose than radium packs. |
| 1923 | Dr Alfred Henry Fuson | Killed after falling from a roof during radio experiments. |
| 1930 | - | First megavoltage x-ray system at MGH and Barts . |
| 1934 | Paterson & Parker | ‘Manchester System’. |
| 1942 | - | Cyclotron-produced iodine-131 is used for treatment of hyperthyroidism, four years later it is also introduced as a treatment for thyroid cancer. |
| 1946 | Mayneord & Mitchell | Cobalt-60 therapy |
| 1949 | Harold Johns | Betatron is invented, a device which accelerates electrons in a circular path by magnetic induction. |
| 1950 | - | Medical Ultrasound |
| 1951 | William Mayneord | Rectilinear scanner, an imaging device to capture emission from readiopharmaceuticals in nuclear medicine. |
| 1953 | - | First linear accelerator is established in Hammersmith. |
| 1960 | Anger | Gamma camera. |
| 1964 | - | Technetium-99m is established as the tracer of choice. |
| 1973 | Hounsfield | Computed Tomography (CT). |
| 1973 | Lauterbaur & Mansfield | Magnetic Resonance Imaging (MRI). |
| 1975 | - | Positron Emission Tomography (PET) is created. |
| 2000 | - | Multimodality Imaging. |
An interesting point to note is that physicists are not involved in clinical use, because as soon as a medical instrument/device is applied it becomes a doctors field and expertise
At the start of the twentieth century hospital physicists were mainly employed in radiotherapy and radiation protection. In the UK during 1932, only 10 - 12 hospital physicists existed and now this has grown to over 1500 physicists in 2010.
The reason for this exponential growth in numbers is the rapid advancement in new imaging and clinical measurement techniques briefly discussed above. As a result various bodies have been founded:
In 2000, medical physicists and clinical engineers were regulated as ‘clinical scientists’, and became a fully-fledged healthcare profession.
With the quick progression of medical physics a lot of new areas have arisen, and now medical physicists have a large range of responsibilities ranging from a more physics based to a more engineering based:
| Increased physics content |
| Radiotherapy physics |
| Radiation protection |
| Diagnostic radiology |
| Nuclear medicine |
| Magnetic resonance imaging |
| Ultrasound |
| Non-ionising radiation |
| Physiological measurement |
| Biomechanics |
| Medical electronics |
| Assistive technology |
| Medical engineering design |
| Medical equipment management |
| Increased engineering content |
Radiotherapy is the treatment of disease (usually cancer) using very high doses of X-ray or particle radiation. The particular role medical physics plays is to:
Medical physics also has a large involvement in imaging using x-rays and computed tomography:
In nuclear medicine, radioactive materials can be used to obtain images of tissue function, or in larger quantities, to treat disease. With medical physics helping to:
MRI is structural and functional imaging using magnetic fields and radio waves instead of ionising radiation. The particular role medical physics plays is to:
Clinical engineering focus on:
Medical physicists can also dedicate their time to research and development:
Some other areas of medical physics include ultrasound, radiation protection, lasers and optical imaging.
There are three main fields that medical physics and clinical engineering can take you into:
Most large hospitals have a ‘Medical Physics and Clinical Engineering’ department. You need:
There are over 30 UK universities active in medical physics/engineering research, many with international reputations. You need:
Many leading companies have large UK facilities, and there are many specialist UK companies with innovations, for example in lasers, ultrasound and medical devices.
Learning Objectives
- Benefits and detriments of ionising radiation
- Development of radiation protection
- Quantities and units used in radiation protection
- Deterministic and stochastic effects of ionising radiation
- Quantitation of radiation risk
- Principles of radiation protection
In 1896 a German physics professor, William Röntgen, found a new kind of ray which he called the ‘x-ray’. There was an immediate worldwide excitement and Henri Becquerel quickly discovered radioactivity a year later. Then on 26 December 1898, Marie Curie and her husband Pierre announced the existence of a new element, which they name ‘radium’. They were fascinated by its effects on destroying tumour cells faster than the surrounding healthy cells. And within a few years systems were being devised to treat cancer.
In the beginning radiographs were initially made onto glass photographic plates, film wasn’t introduced until 1918 thanks to George Eastman. Right from the start x-rays were used as a therapy, for ailments such as skin lesions.
Many early radiologists tested the strength of their radiotherapy machines by using their own arms. If their skin turned pink then this was estimated to be the correct ‘erythema dose’ as they called it. Unfortunately, unaware at the time a lot of them ended up developing leukaemia from exposing themselves to so much radiation.
Soon people started to think that radiation was a ‘wonder cure’ for everything and a whole host of alternative therapies arose:
However with the increased popularity of radiation, it was soon discovered that an excess of radiation would not cure cancer and other ailments but end up having a detrimental effect on human health.
One of the first warnings of possible adverse side effects came from Thomas Edison, William J. Morton and Nikila Tesla who all reported independently of one another, eye irritations from experimentation from x-rays and fluorescent substances.
Elihu Thomson, an American physicist, deliberately exposed one of his little fingers to an x-ray tube for several days (half an hour a day) and ended up experiencing pain, swelling, stiffness, erythema and blistering.
As it became more and more apparent that radiation is harmful when used incorrectly, safety measures were slowly introduced to try and reduce the harmful effects of radiation.
People start to use protection such as lead clothing.
British x-ray and Radium committee introduces regulations:
Is a meeting of radiologists, where they can exchange their ideas and harmonies the international standards and practice of radiology. With the first meeting in London in 1925, it is still running today with its 29th meeting in Buenos Aires in 2016.
The Röntgen (R) is the amount of radiation to produce a certain amount of ionisation in a given volume of air.
First dose limit. ICRP recommends a tolerance dose limit of: 0.2 rad/day (~ 500 mSv/y)
Reports of increases in leukaemia and other cancers from bomb survivors and therapy patients. Risk extrapolates to zero dose (no safe dose).
As soon as it became understood that radiation is harmful when not used carefully, ways of measuring its dose were calculated and here are three different types:
This reflects the amount of energy that radioactive sources deposit in medium (e.g. water, tissue, air) through which they pass. The absorbed dose can be calculated with the following equation:
Units are in Grey (Gy, mGy, cGy), 1 grey = 1 joule per kg. Different absorbed doses can lead different effects.
With a radiation exposure 1 - 10 Gy, symptoms can include:
A therapy for this amount of exposure is using symptomatic transfusions of leucocytes and platelets, bone marrow translation and growth stimulating factors. Prognosis is excellent to uncertain with survival rates ranging from 10% to 100%.
With a radiation exposure 10 - 50 Gy, symptoms can include:
Palliative care would be recommended, this may include controlling the diarrhoea and fever as well as replacing lost electrolytes. If you are lucky some morphine. Prognosis is very poor, survival rate is 10%.
With a radiation exposure greater than 50 Gy, you can expect to see the following symptoms:
Symptomatic treatment would be advised to ease the above symptoms. Prognosis is hopeless, with the survival rate being 0%.
Is the dose which would cause death to 50% of the population in 30 days. Its value is about 2-3 Gy for humans for whole body irradiation.
RBE is the ratio of biological effectiveness of one type of ionising radiation relative to another, given the same amount of absorbed energy. See the graph below for a few examples:
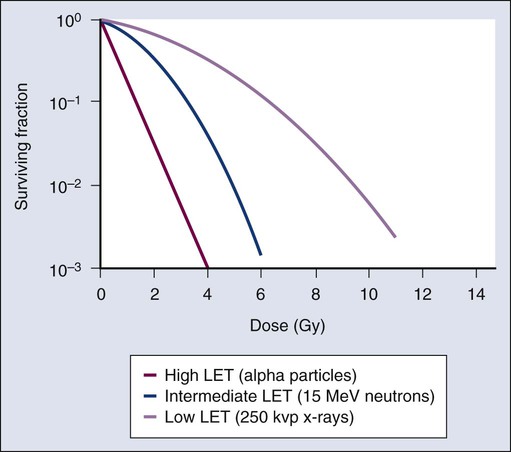
Note: LET stands for Linear Energy Transfer
This is a measure of the radiation dose to tissue where an attempt has been made to allow for the different relative biological effects of different types of ionising radiation. It is used to assess how much biological damage is expected from an absorbed dose, as different types of radiation have different damaging properties. Equivalent dose is calculated with the following equation:
Equivalent dose is measured in Sieverts (Sv, mSv) but REM (Roentgen Equivalent in Man) is commonly used as well, where 1 Sv = 100 REM.
This determines how dangerous an individual’s exposure to radiation can be, by taking into consideration not only the nature of the incoming radiation but also the sensitives of the body parts affected.
Effective dose is measure in Sieverts (Sv, mSv) and below are some common tissue weighting factors:
| Tissue | Wr | $\sum$ Wr |
|---|---|---|
| Bone marrow, Brest, Colon, Lung, Stomach | 0.12 | 0.60 |
| Gonads | 0.08 | 0.08 |
| Bladder, Oesophagus, Liver, Thyroid | 0.04 | 0.16 |
| Bone surface, Brain, Salivary Glands, Skin | 0.01 | 0.04 |
| Remainder Tissue | 0.12 | 0.12 |
Here are a few example calculations using the above principles:
Ionisation is the process by which an atom or a molecule acquires a negative or positive charge by gaining or losing electrons to form ions, and this is often caused by radiation. Ionising radiation can have potentially disastrous effects on our body at a cellular level, causing radiochemical damage by either direct or indirect action:
Direct action occurs when alpha particles, beta particles or x-rays create ions which physically break the sugar phosphate backbones or the weak hydrogen bonds holding together the base pairs of the DNA. However, heavy charged particles (alpha particles) have a greater probability of causing direct damage compared to the low charged particles (x-rays) which cause most of the damage by indirect effects.
Indirect action is when ionising radiation effects other biological molecules such as water. It can impair or damage cells indirectly by creating free radicals which are highly reactive due to the presence of unpaired electrons on the molecule.
H2O + Radiation H2O+ + e-
Free radicals may form compounds, such as hydrogen peroxide, which could initiate harmful chemical reactions within the cells.
H2O OH H2O2
Following these chemical changes cells may undergo a variety of different processes.
Once damaged DNA usually usually repairs itself through a process called excision, this process has three main steps:
Unfortunately this method is not fool-proof and sometime DNA is incorrectly repaired. This can either lead to cell death or a mutation (either a substitution or a frameshift). And occasionally this could lead to the formation of cancer.
With any exposure to radiation there is a risk that damage can occur and there are three main types:
The biological effects of radiation can be classified in two ways, deterministic and stochastic:
Deterministic effects describe a cause and effect relationship between radiation and some side-effects. They are also called non-stochastic effects to contrast their relationship with the chance-like stochastic effects, e.g. of cancer induction.
Deterministic effects have a threshold below which, the effect does not occur. The threshold may be very small and may vary from person to person. However, once the threshold has been exceeded, the severity of an effect increases with dose. Some examples of deterministic effects include:
Note: Doses given at absorbed dose
| Tissue | Effect | Threshold Dose (Sv) |
|---|---|---|
| Testes | Sterility | 0.15 (temp) |
| Ovaries | Sterility | 3.5-6 (perm) |
| Lens | Opacities (Cataract) |
0.5-2 5 |
| Bone marrow | Depression of haematopoeisis | 0.5 |
Stochastic effects occur by chance. Cancer induction as a result of exposure to radiation occurs in a stochastic manner aS there is no threshold point and risk increases in a linear-quadratic fashion with dose. This is known as the linear-quadratic no threshold theory. Although the risk increases with dose, the severity of the effects do not; the patient will either develop cancer or they will not.
You can determine stochastic risk by creating epidemiological studies using risk data form:
You can quantify this risk, for example the medical radiation risk (at 5% per Sv) in the table below:
| Procedure | Effective Dose (mSv) | Risk (per million) |
|---|---|---|
| Dental OPG | 0.08 | 4 |
| CXR | 0.03 | 2.5 |
| Abdom. X-ray | 2.0 | 100 |
| IVU | 4.0 | 200 |
| Barium Enema | 8.0 | 400 |
| CO-58 B12 | 0.2 | 10 |
| Tc-99m V/Q | 1.0 | 50 |
| Tc-99m Bone | 3.0 | 150 |
| Abdo Ct | 15.0 | 750 |
The following are three fundamental principles of radiation protection, taken from the ICRP (International Commission on Radiological Protection) system:
The principle of justification requires that any decision that alters the radiation exposure situation should do more good than harm; in other words, the introduction of a radiation source should result in sufficient individual or societal benefit to offset the detriment it causes.
The principle of optimisation requires that the likelihood of incurring exposures, the number of people exposed and the magnitude of their individual exposure should all be kept as low as reasonably achievable, taking into account economic and societal factors. In addition, as part of the optimisation procedure, the ICRP recommends that there should be restriction on the doses to individuals from a particular source and this leads to the concept of dose constraints.
The third principle of the ICRP’s system of protection is that of dose limitation. This principle requires that the dose to individuals from planned exposure situations, other than medical exposure of patients, should not exceed the appropriate limits recommended by the Commission.
Following a malfunction in the cooling circuit of an experimental nuclear reactor there was a catastrophic failure leading to an explosion. A monitoring station on the periphery of the reactor site at a distance of 100m from the reactor showed that the whole body absorbed dose to an individual at that point would have been 20 Gy from the initial radiation burst after the explosion. Other monitoring instruments indicated that the radiation in the burst was comprised 70% gammas and 30% neutrons.
Material vaporised during the explosion entered the atmosphere where it was distributed widely by the prevailing Westerly wind. Monitoring stations at 500m from the reactor recorded the absorbed dose to the lungs following inhalation of particulates from the plume. These particulates comprised 90% gamma-emitting isotopes and 10% alpha-emitting isotopes.
In the direction of the wind the total lung absorbed dose would have been 10 Gy. Individuals at the same distance from the reactor but at 900 to the wind direction would have received only 30% of this absorbed dose to the lungs. Individuals at 500m and in the opposite direction to the wind would receive no absorbed dose from particulates in the plume.
Make an estimate of the percentage increase in cancers expected in populations at distances of 1000, 2000 and 3000m from the reactor at the four cardinal points of the compass. Fully describe each step taken in reaching your answers.
You can assume that the inverse square law applies to both the initial radiation burst and the subsequent distribution of the plume. Also assume that the radiation weighting factor for neutrons is 2 and for alpha particles, 20. The only significant organ dose following inhalation is to the lungs.
Solution coming soon
Learning Objectives
- Production of x-rays
- Forming x-ray images
- Advanced imaging techniques
- Digital imaging
A basic x-ray tube is formed of a cathode filament, an anode metal target enclosed in an evacuated glass bowl. There is also a shield which encloses this again, with only a small window to allow x-rays to pass through.

Current is applied through the filament, and there is thermionic emission of electrons from the filament. Then a high voltage is applied across that, causing electrons to flow across to the target leading to the emission of x-rays.
The HV Rectifier ensures that there is always a positive voltage on the anode relative to the cathode. So in essence a sine wave is always positive (negative values are reflected back to positive values along x-axis), this is also called a full wave rectifier. In a half wave rectifier only the positive or negative values are rectified not both.
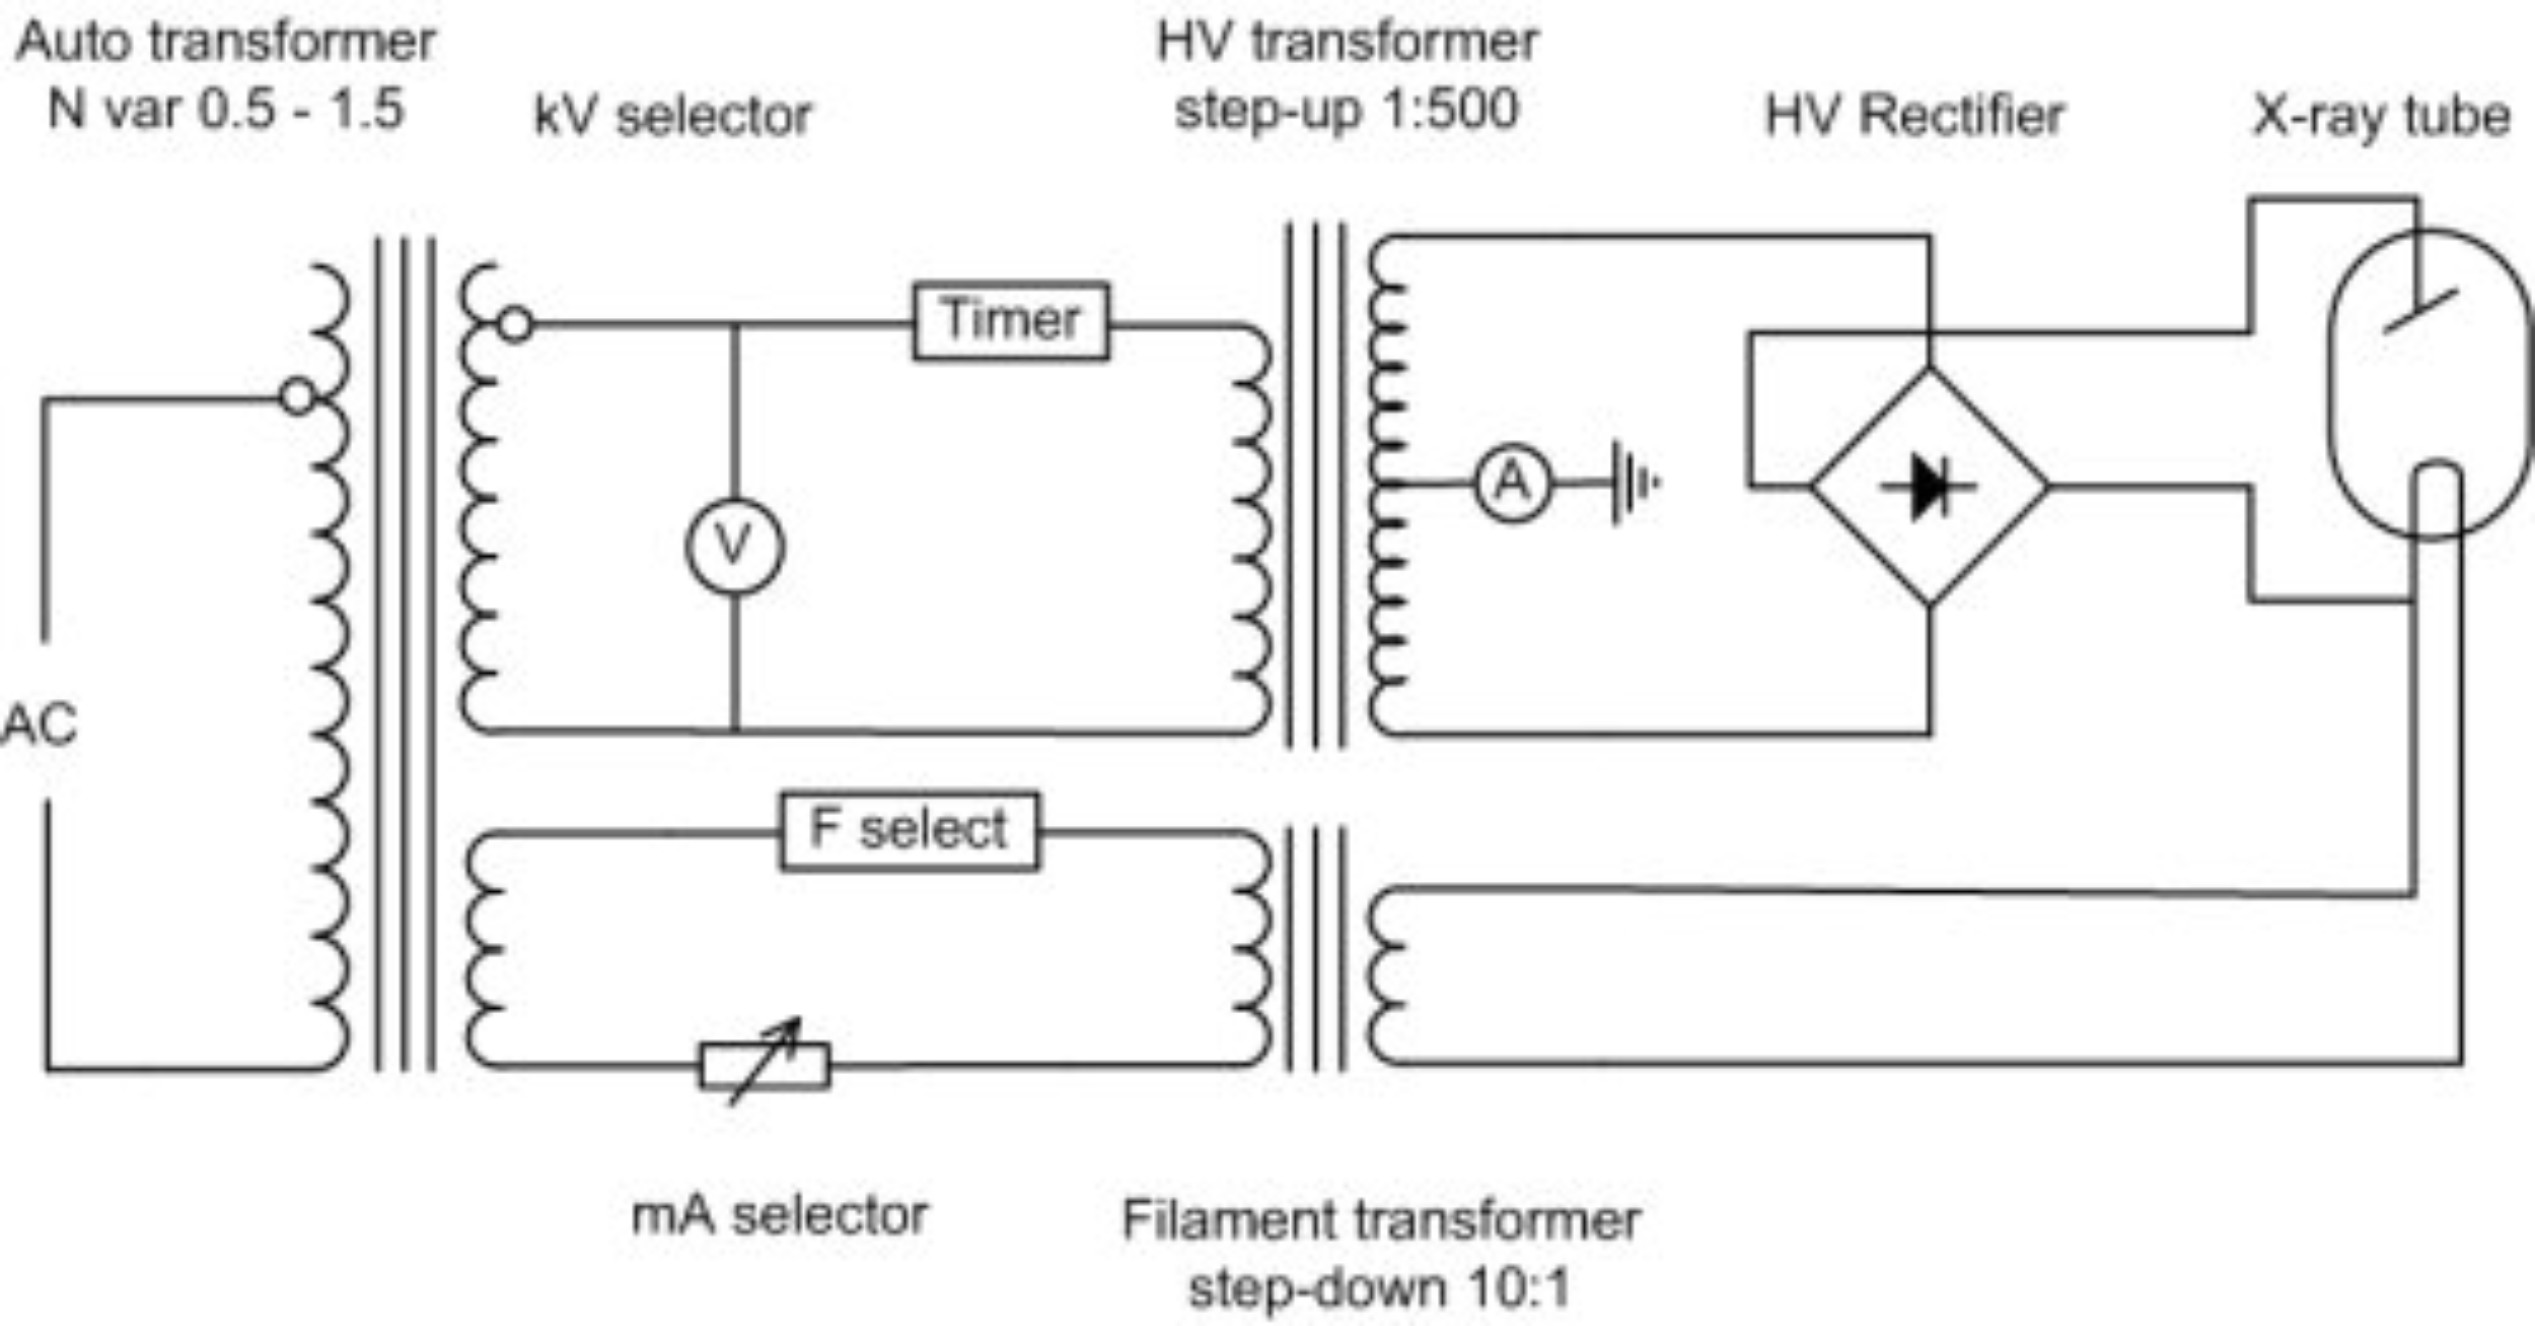
In modern x-ray tubes the anode rotates to prevent overheating as almost 99% of the energy required to produce x-rays is converted to heat. It is a very inefficient process. The whirring sound which you hear when having an x-ray is causing by the rotating anode, and the ‘clunk’ is the x-ray itself, the high voltage part of it. The cathode has one or more filaments (often two) to give a broad focus and a fine focus. This helps with the resolution of the x-ray tube.
If you overheat an anode, it can become significantly damaged, with concentric circles becoming apparent where the electrons are focused. And if the anode stops spinning but electrons are still ‘fired’ at it pitting can occur as well, effectively destroying the tube.
The tube housing encases the the x-ray tube. It is often made out of lead and it stops x-rays from being scattered in every direction. It contains a window from which they are emitted with a filter (often aluminium) blocking the lower energy x-rays as these do not help to form an image. Therefore reducing the amount of radiation the patient is exposed to.
Note: Photon energy is measured in kVp
Below the housing is a light-beam diaphragm which is co-incident with the x-ray beam. This shows the radiographer where the x-ray images be taken of the patient.
The x-ray spectrum is formed from Bremsstrahlung (a continuous element) and a series of characteristic x-rays.

Note: In a diagnostic x-ray machine Bremsstrahlung is most important, radiographers are not really interested in the characteristic x-rays
Is the electromagnetic radiation produced by the deceleration of a charged particle after passing through the electric and magnetic fields of a nucleus. The kinetic energy that is lost by the charged particle is emitted as an electron.
Characteristic X-rays are produced when a material is bombarded with high-energy particles (electrons), some of the electrons surrounding the atom are ejected. These spaces created around the atom need to be filled. These outer electrons in higher shells cascade down to fill the vacancies causing emission of x-rays of characteristic of element.
For example, as electrons travel from the L shell to the K shell, creates a K-alpha x-ray. If an electron falls from the M to the K shell a K-beta x-ray is emitted.
Note: Innermost shell is K then L and Outermost shell is M
To form images, x-rays must attenuate in tissue. There are two iterations that happen at diagnostic energies, the Photoelectric effect and the Compton effect.
The photoelectric effect is a form of interaction of X-ray or gamma photon with the matter. A low energy electron interacts with an electron in the atom and removes it from its shell. This is very likely if the electron is:
The electron that is removed is called a photoelectron; the incident photon is completely absorbed in the process; all photon energy is transferred to the electron.
Electron energy = Photon energy - Binding energy of electron
The photoelectric effect is related to:
Small changes in Z can have quite profound effects on the photoelectric effect, this has practical applications in the field of radiation protection. Hence materials with a high Z, e.g. lead (Z = 82) are useful shielding materials.
Compton scatter is one of the main causes of scattered radiation in a material. It occurs due to the interaction of the X-Ray or gamma photon with free electrons/loosely bound valence (outer) shell electrons. The resultant incident photon gets scattered (changes direction) and transfers energy to the recoil electron. The scattered photon will have a different wavelength and thus a different energy. The Klein-Nishina formula describes the compton effect and shows how energy and momentum are conserved.
The scattered x-rays therefore have a longer wavelength (and a lower energy) than those incident on the material. The Compton effect does NOT depend on the atomic number (Z) of the material, but does depend strongly on electron density.
The standard x-ray is a negative image with the bones in white representing a higher attenuation. Bone is significantly more attenuated at lower energies than the soft tissues (muscles and fat) which are represented by a grey colour. No attenuation leads to a black image, for example in the lungs or the gut (because they are full of air). This difference in attenuation gives the x-ray image. Radiating at a lower energy reduces photon attenuation and increases contrast.
$ n_x = n_0 e^{-\mu x} $
μ is the attenuation coefficient
There are two properties that are most talked about which are contrast and sharpness (resolution).
A ‘flat image’ is an image with little contrast and is often due to a high amount of attenuation. Radiating at lower kVs reduces attenuation (using photoelectric effect) and leads to higher contrast in the image.
This is partly a property of an X-ray tube. A larger filament leads to a worse image resolution, and bad image resolution often has a large penumbra (a region of ‘partial eclipse’ or geometric ‘unsharpness’). Also if the imaging plate is not directly beneath the object the penumbra increases. Inside the cathode, a large wire filament can be used within the focusing cup to produce a large focal spot; a small filament can be used for a small focal spot. However, there is a disadvantage to having a small penumbra (and high resolution image): electrons are concentrated on a small area, which is more damaging to the X-ray tube.
Scatter due to the Compton effect does not help image formation and adds a ‘fog’ to the image. You can prevent excessive scatter noise by using an anti-scatter grid, although this means there is a higher dose given to the patient; with an anti-scatter grid you need more X-rays to form a good image.
Contrast agents are used to improve images produced by X-ray, CT, MRI and ultrasound. These substances temporarily change the way x-rays or other tools interact with the body. When introduced to the body, contrast materials help to distinguish certain structures/tissues to allow diagnosis of medical conditions.
An image intensifier has a large area at the front and a small area at the back to minify the image and accelerate electrons to give you the energy enhancement sufficient to produce a good image on a screen. Examples of use include conventional fluoroscopy and a C-Arm image intensifier used in a cardiac/angiography room to look at problems in the heart.
The x-rays interact in a photocathode (caesium iodide) which changes them to electrons. The electrons are then accelerated across a voltage and are focused on output screen (phosphor).

An example of the use of an image intensifier is in combination with iodine contrast media to look at a beating heart, watching for any irregularities. Another use is in combination with barium and looking at swallowing in the oesophagus.
Advances in technology has allowed us to move on from viewing X-ray on an analogue screen/film to digital ways of looking at X-Ray images. An old digital process was the use of Computed Radiography (CR) with imaging plates. However hospitals these days use Direct Digital Radiography (DDR) which is an instantaneous process as the imaging plates are now made up of diodes. With this process there is no need to wait for film to be developed or read CR plates.
Digital images allow radiographers to enhance them by zooming, inverting, post processing, filter and edge enhancing. These allows them to manipulate the images allow them to see certain structures such as blood vessels more easily.
Digital Subtraction involves taking two images, one before contrast injection and one after. If you subtract one from the other you end up enhancing the structure you want to see more clearly. However a drawback is that there can’t be any movement between the two images.
Dual-energy X-ray absorptiometry is a means of measuring bone mineral density (BMD). Two X-ray beams irradiate at different energy levels and are aimed at the patient’s bones. When soft tissue absorption is subtracted out, the BMD can be determined from the absorption of each beam by bone. Dual-energy X-ray absorptiometry is the most widely used and most thoroughly studied bone density measurement technology. It is a very low dose technique commonly used for people with osteoporosis.
Learning Objectives
- Understand the basic principles of CT scanning
- Understand the basic principles of CT image formation
- Understand the source of typical artefacts in CT imaging
Computed Tomography (CT) is a radiography technique in which a three-dimensional image of a body structure is constructed by computer from a series of plane cross-sectional images made along an axis.
The word tomography is derived from Ancient Greek τόμος tomos, “slice, section” and γράφω graphō, “to represent, study”.
CT is a very widely used general diagnostic radiographic technique. However compared to a planar x-ray instead of just taking one image it takes as series of projections around an axis forming many different slices. More clinically useful information can be received with a CT scan but at the cost of giving the patient a higher dose.
Planar radiography renders a 3D volume onto a 2D image. Conventional planar skull X-rays (SXR) were traditionally poor for head images due to lots of overlapping structures and skull dominating the projection making it hard to see any other information in the head. However with a sliced CT image one can clearly see the the ventricles in the brain. There are more problems with planar x-rays as well:
Is where different attenuation (or CT number) values are mapped out in order to form an image. It was developed by Johann Radon in 1917 and is related to Fourier Transforms.
Given an infinite number of one-dimensional projections taken at an infinite number of angles, you can reconstruct the original object perfectly
The basic components of CT Scanner are:
The first generation of CT Scanner had the following characteristics:
The third (current) generation of CT scanner vastly improved upon the previous generations and had the following characteristics:
CT is very demanding of X-ray tubes and generators as scans are required instantaneously (up to 700 mA) and sequences can take over 30 seconds. This requires a large heat capacity and fast cooling rates. Mechanical stresses due to tube rotation are very large as well and are over 15G for 0.5s rotation.
Filtration in the x-ray tube and housing absorbs low energy X-rays, which contribute to the patient dose but not to the image quality. Equivalent to as much as 13mm aluminium.
After normal filtration, another filter is present in a CT scanner and known as a bow-tie filter. The edges of the patient to be x-rayed are thinner and therefore have less attenuation. This bow-tie filter lessens the intensity of the x-ray beam at the edges (more intense beam at the centre) so the beam incident at the detectors is more constant and it also removes soft X-rays.
These are a critical component as they record the intensity of the incident X-rays sending out a signal. There are many different types including:
These detectors have to perform well and be efficient under lots of physical stress
Detectors in 3rd generation scanners are arranged in an arc around the patient. There are approximately 600 to 900 elements in a detector bank which allows for good spatial information. Both the tube and the detectors rotate around the patient.
To try and reduce dose and make scanning even faster, the table also moves while X-Ray tube and detector rotate during acquisition. A problem with this is that some gaps can form in the images of the patient, however these can be filled in with interpolation.
Is the speed of the table movement through the gantry defines the spacing of the helices.
$ Helical \ Pitch = \frac{Table \ Travel \ per \ Rotation}{X-ray \ beam \ Width} $
For Example: An increase in pitch increases the movement of the table, decreases the amount of time required however leads to more gaps between the images.
To reconstruct the data as normal, the CT scanner uses a combination of data 180° each side of a recon (reconstruction) position and interpolation. Interpolation averages data on either side of the reconstruction position to estimate the projection data at that point.
As a result, a interpolated helical scan is able to reduce artefacts due to changing structure in z-axis when moving the table. For any set reconstruction position, only one scan projection will be available at that point.
Note: Data at 180° at either side of the recon position is more commonly used than 360° on one side as z-axis interpolation distances are shorter. Also 180° interpolator makes use of the opposite (Anterior-Posterior & Positive-Anterior) views producing a second complementary spiral for interpolation
A few advantages of helical scanning are:
A disadvantage is the broadening of the slice profile, however this can be overcome using a 180° interpolator at the expense of image noise.
The objective of CT image reconstruction is to determine how much attenuation of the narrow x-ray beam occurs in each voxel of the reconstruction matrix. These calculated attenuation values are then represented as grey levels in the 2D image of the slice.
All tissues or material has a linear attenuation coefficient which is summed along the path between the tube and the detectors, as well as varying with energy.
Note: µ relates to z (atomic number), ρ (physical density) and E (X-ray energy)
A map or array of picture elements (pixels) presenting a grey scale (pixel value) relating to the stored value which is the calculated result of the tomographic reconstruction of projection data relating to the attenuation in a volume cell (Voxel) in a patient. Each 2D pixel in a CT image represents average attenuation within a 3D voxel.
Many attenuation measurements are taken, with a sample at each detector position generating a profile. This gives view of a patient at one orientation; a projection. A number of projections are collected from views all around the patient. Different manufacturers have different combinations of detectors.
Back projection is a mathematical function that is applied to the attenuation data that you find, which reverses the process of measurement of projection data to reconstruct an image. Each projection is ‘smeared back’ across the reconstructed image. Consider each projection as an intensity map, where white is high attenuation (something ‘hard’) and dark is low attenuation (nothing there).
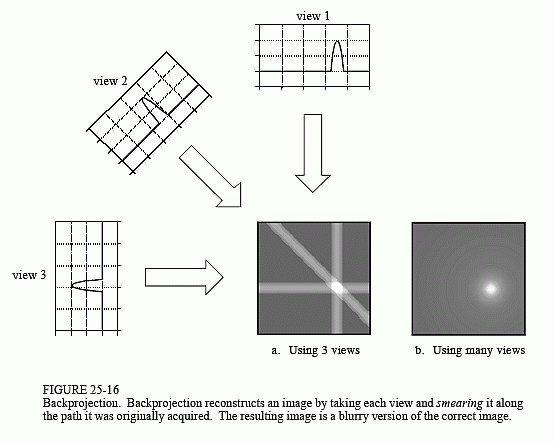
However the output back projection trans-axial image is blurry. The projection data needs to be processed before reconstruction. Kernels (mathematical filters) can be applied for different diagnostic purposes. Smoothing for viewing soft tissue and sharpening for high resolution imaging. This post-processing in combination with back-projection is known as filtered back projection.
A normalised attenuation number using fixed reference points of water & air.
$ CT = \frac{\mu_{tissue} - \mu_{water}}{\mu_{water}} \times 1000 $
Hounsfield units are the standard units for CT number in medical imaging with water at 1000 HU and air at -1000 HU.
We can change the appearance of the image by varying the Window Level (WL) and Window Width (WW). This spreads a small range of CT numbers over a large range of grayscale values, making it easy to detect very small changes in CT number.
This occurs in 3rd generation CT scanners. If one detector is out of calibration with the other detectors, this consistently gives erroneous readings at each projection. A circular artefact is presented.

If an object is continuous is the z-axis the CT number is not affected by the z-sensitivity. If an object varies in z-axis (especially using helical scanning), the ‘partial volume effect’ will alter CT number. To solve this problem the pitch can be reduced.
As an x-ray beam passes through a material is becomes more attenuated and becomes ‘harder’ the further it travels. The peak energy of the x-ray beam starts moving higher up the spectrum, so becomes more penetrating and more intense at the detectors. This various artefacts to appear:
These are caused when density of material is beyond the normal range of a scanner computer (incomplete attenuation profiles). It is compounded by beam hardening, partial volume and aliasing. Filters can be applied to reduce the metal artefacts, but ideally metal objects are removed however this is not possible with implants!
If the object moves while the scanning takes place, misregistration artefacts appear as shading or streaking. To prevent this, the CT operator will tell a patient to hold their breath will scanning, to minimise any movement due to breathing.
Learning Objectives
- Understand what “good clinical image quality” means
- Learn about the three key technical IQ metrics (spatial resolution, contrast and noise), how these can be measured and the impact on Image Quality (IQ)
- Understand advantages and limitations of digital images
- Identify the contents of DICOM clinical image files and the typical size/archiving requirements
- Learn about the contrast limitations of the human visual system and the value of post-processing tools.
- Calculate the size of image files from given detector specs, data and image characteristics
- Apply the concept of Nyquist frequency to digital imaging problems.
- Overview of Information technologies (IT) in healthcare, including Picture Archive and Communication Systems (PACS) and Electronic Health Records (EHR).
There are many different imaging modalities:
Image Quality (IQ) is a general and subjective concept best described within the context of the specific task. An image with a good IQ has suitable characteristics for the intended use which could be screening, diagnostic, intervention or follow up.
Note: IQ does not mean aesthetically beautiful images!
For example in breast imaging, a high image quality enables detection and characterisation of:
Ideally with a high (100%) sensitivity (the ability to correctly identify the structures, the true positive rate) and a high (100%) specificity (the ability to correctly identify the structures without disease, the true negative rate).
$ Sensitivity = \frac{True \ Positive}{True \ Positive \ + \ False \ Negative} \times 100 $
$ Specificity = \frac{True \ Negative}{True \ Negative \ + \ False \ Positive} \times 100 $
Image quality is affected by information content, perception/interpretation and decisions by the observer:
Routine quality control aims to monitor equipment performance over time and compare it with a baseline/reference to ensure it adheres to the intended standards through the lifetime of the equipment.
Modalities involving ionising radiation require image quality to be complaint with ALARA/ALARP.
Analogue systems using film were sensitive to an upper and a low threshold. Too low a dose would result in the film being underexposed and too high a dose would result in the film being over exposed.
However digital systems (CR and DR) have wider dynamic range and are tolerant to sub-optimal exposure conditions. Therefore it is very hard for the operator to distinguish whether the machine is malfunctioning and potentially the patient could receive too little or too much radiation dose (dangerous!).
A digital image is an array of numbers assigned to each pixel or voxel. In a digital image the picture is broken down into discrete blocks. In a 2D system each block is termed a pixel (picture element) and in a 3D system each block is termed a voxel (volume element). A digital image is numerically described by:
The array size determines the sampling frequency (pixels/mm). The higher the sampling frequency the better the representation of the object detail.
The bit depth determines the number of possible values that can be assigned to a pixel. Quoted as the number of bits allocated to the image, so the simplest image would be 1-bit = 21 = 2 possible values = black & white.
| 1 bit | 1 binary digit |
| 2 nibble | 4 bits |
| 1 byte | 8 bits |
| 1 word | 2 bytes (generally) |
| 1 kilobyte | 210 = 1024 bytes |
| 1 megabyte | 220 = 1024 kbytes |
| 1 gigabyte | 230 = 1024 Mbytes |
The Human Visual System (HVS) is a little under 8-bit i.e. can distinguish ~200 Just Noticeable Differences (JND) in grey scale level. Medical imaging detectors and displays are typically 12-bit (i.e. 4096 grey levels) as post-processing tools manipulate and optimise the image for HVS.
Note: The representation of an object improves as the array size and bit depth are increased.
Image Size = 2300 x 1900 x 2 byte per pixel
Image Size = 8 740 000 bytes
Answer = 8.3 Mb
Digital images are normally viewed:
The same image at different window width and level settings show different information. Post processing may generate artefacts in the image (e.g. high level of edge enhancement may suggest that an implant is loose).
Lossy compression can make a file a lot smaller, however it is required by law that medical images have a lossless compression (to avoid any degradation in quality that could cause a change in diagnosis).
| Advantages of Digital Images | Disadvantages of Digital Images |
|---|---|
| Wide Dynamic range | Lower spatial resolution (Still may be adequate for clinical task) |
| Post processing capabilities | Initial cost can be high |
| Portability & telemedicine | Users have to monitor dose/patient exposure closely |
| Security & backup | |
| Less physical storage space required | |
| Advanced applications (CAD, Image subtraction, tomosynthesis, etc) | |
| Clean and safe processing |
Medical images are usually in the Digital Imaging and Communications in Medicine (DICOM) format. A DICOM file has two components:
All electronic detectors produce an analogue signal which varies continuously and which depends on the amount of radiation (or other form of energy) received by the detector. In most modern electronic imaging systems, the analogue system from the detector is transformed into a digital signal, that is a signal that has a discrete, rather than continuous values. During this transformation obviously some information is lost.
| Study | Archive capacity required (uncompressed Mb) |
|---|---|
| Chest X-ray (PA + L, 2 x 2 kby) | 20 |
| CT series (120 images, 512 x 512) | 64 |
| SPECT myocardial perfusion study (TI 201) | 1 |
| US study (60 images, 512 x 512) | 16 |
| Cardiac catheterisation | 450 - 3000 |
| Mammogram (screening) 2x CC + 2x MLO | 32 - 220 |
Spatial resolution, contrast and noise are the three key indicators of Image Quality. From these descriptors, Signal-to-Noise Ratio (SNR) and Contrast-to-Noise Ratio (CNR) can be derived. When measured under controlled conditions these can be very useful values.
SNR shows how many times stronger the signal is compared to the noise (signal variations). If all the sources of non-random noise can be removed than then the dominant source of noise is random (Poisson) distribution.
$ SNR = \frac{signal}{noise} = \frac{signal}{\sqrt{signal}} = \sqrt{signal} $
CNR is a useful metric in medical imaging as it allows us to quantify subtle variations in signal between objects and their surrounding background.
$ CNR = \frac{ \vert signal_{obj} \ - \ signal_{bkgd} \vert }{noise_{bkgd}} $
Its best to have a high photoelectric absorption and low Compton scatter. Important requirements of an imaging system is that is has a high signal detection efficiency with a high SNR and a high CNR.
An ideal detector would produce an exact representation (sharp response) of the object irrespective of the spatial frequency. However in reality the response is more curved. Spatial resolution affects the visibility of detail in an image and the ability to detect small structures close to each other. Poor spatial resolution of the imaging system shows a blur in the image. Decreasing the pixel size improves the spatial resolution at the cost of more noise as there are less photons per area (unless you increase the dose to compensate for this).
Nyquist-Shannon’s Sampling Theorem states if you have a signal that is perfectly band limited to a bandwidth of f0 (cycles/mm) then you can collect all the information there is in that signal by sampling it at discrete times, as long as your sample rate is greater than 2f0 (samples/mm)
For example, if the maximum frequency in the object is 2cycles/mm then the sampling must be done at least 4 cycles/mm.
$ N_F = \frac{1}{2 \times Pixel \ Pitch} $
Where the pixel pitch is the distance between two adjacent pixels.
Under-sampling occurs at a sample rate below the Nyquist rate. This leads to misrepresentation of the signal, loss of information and generation of artefacts.
| Imaging Modality | Pixel Size | Nyquist frequency lp/mmm |
|---|---|---|
| Mammography | > 0.080 m | 6.3 |
| General Radiography | > 0.143mm | 3.5 |
| Fluoroscopy | > 0.200mm | 2.5 |
Contrast key to detect subtle signals and is determined by the relationship between the magnitude of the signal and the magnitude of the fluctuations in the signal (noise). It depends on the composition and thickness of an object as well as the properties of the detector such as noise.
An ideal imaging system would:
However no such detector exists and noise is fashioned which prevents the visibility of small/low contrast details. Some sources of noise include:
Noise can be reduced, but never eliminated completely. CNR provides valuable data to investigate drops in Image Quality.
HIT has changed the way healthcare is provided. It holds great promise towards improving healthcare quality, safety and costs. Some examples of IT in healthcare:
There were some key milestones in the development of PACS:
PACS continue to develop, with technological advances making implementation similar and cheaper. Much current development focus on workflow and systems integration. At the moment, PACS typically comprises of:
May have additional networks to the other IT systems (HIS, PAS, RIS)
This is a record of important clinical information about the patient, and provides key performance indicators for the hospital or specialist unit (e.g. to support research, help planning new services):
The EHR can be created, managed an consulted by authorised providers and staff across more than one health care organisation. It can bring together information from current and past doctors, emergency facilities, school and workplace clinics, pharmacies, laboratories and medical imaging facilities.
The UK shows the biggest take-up of electronic health records in Europe. $2.1 billion (4% annual growth) was spent by the UK by the end of 2015 compared to $9.3 billion (7.1% annual growth) spent by the US.
The top 10 functions where doctors globally perceive a positive impact of EMR and HIE:
However there are some challenges of implementing EHR. Potential of EHRs meets problems of implementation as they could distract from doctor-patient relationships, wasting valuable time and driving up costs (costly to maintain).
What does “good IQ” means in the context of medical images?
A good IQ has suitable characteristics for the intended use which could be screening, diagnostic, intervention or follow up.
What factors that influence IQ?…and perceived IQ?
Answer coming soon
What are the 3 key technical descriptors of IQ?
Answer coming soon
What are the main sources of noise in X-ray imaging? And their causes?
Answer coming soon
How can CNR be measured? What affects it?
Answer coming soon
How can the performance of a medical monitor be assessed?
Answer coming soon
What data is contained in a DICOM file?
Answer coming soon
How does image matrix size and bit depth affect image quality?
Answer coming soon
What differences are expected between an 12bit and a 8bit image?
Answer coming soon
How does SNR relates with the number of photons used to produce an X- ray image for an ideal x-ray imaging system?
Answer coming soon
What is spatial resolution and how can it be improved for a digital system?
Answer coming soon
Discuss advantages and limitations of digital imaging systems?
Answer coming soon
What are the 2 main functions of an Electronic Health Record (EHR)?
Answer coming soon
Give examples of impact of EHR on patient and the healthcare system.
Answer coming soon
What is PACS?
Answer coming soon
How can PACS affect workflow in the imaging department?
Answer coming soon
Discuss key requirements of a hospital PACS?
Answer coming soon
How could IT systems support the management of adverse incidents in a hospital setting?
Answer coming soon
Discuss the introduction of IT technologies in healthcare and how they can bring benefits to patients and the healthcare system?
Answer coming soon
In the plane of the detector what spatial frequency can be recorded by a 512 x 512 pixel digital fluoroscopy system with 150mm x 150mm receptors?
Detector size = 150mm x 150mm
Matrix size = 512 pxls x 512pxls
Pixel pitch (d) = 150mm/512 = 0.293 mm
Nyquist Frequency (Nf) = 1/2.d = 1 /2(0.293) = 1.71 l p/mm
Solution: 1.71 lp/mm
A grayscale chest radiograph is 35cm x 29cm in area and was digitised with a sampling frequency that preserves the inherent spatial resolution in the image which is approximately 5 lp/mm (line pairs per millimetre). Each sample was digitised with 16 bits.
(a) Determine the image array size (in pixels)
The minimum pixel size to preserve the frequency is calculated using the Nyquist theorem:
Nf=1/2p … p=1/(2x5 lp/mm) = 0.1 mm
Image array size (pixels) = 350/0.1 x 290/0.1 = 3500 pxl x 2900 pxl
(b) Calculate the memory (in Megabytes) required to store a chest radiograph composed of an antero-posterior (AP) and a lateral (L) view of the chest (i.e. 2 images)
Memory required for one image
= 3500 x 2900 x 2 = 20 300 000 bytes / 1024 bytes/kbytes
= 19 824 kbytes / 1024 kbytes/Mbytes
= 19.3 Mbytes
Memory required for AP + Lateral ~39 Mbytes
Learning Objectives
- Understand the basic physical and engineering principles of nuclear medicine.
- Be able to discuss the various technologies implemented in nuclear medicine.
- Be aware of the clinical implementation of nuclear medicine
Is functional molecular imaging, which takes advantage of molecular interactions in tissues and organs. Pharmaceuticals tagged with radionuclides are injected into patients. Radiopharmaceutical accumulates in the organ of interest. Then the imaging is performed and the pathway of the pharmaceutical is measured.
Compared to an X-ray, there are some fundamental differences:
Alpha, beta and gamma rays are involved in nuclear medicine. Alpha rays get stopped by paper, beta get stop by aluminium and mostly get stopped by lead.
Radioactive materials are unstable and have insufficient binding energy to hold constituent particles together. With time the nucleus changes and the number of protons/neutrons change. These changes result in the emission of radiation. Decay probability is characteristic of the nucleus. Radioactivity is measured in Becquerels (disintegrations per second).
Half-life is the time required for half the atoms to decay. The activity is also reduced by half.
A = A0e-λt
Where λ is the decay constant
If we have 100 MBq of Tc-99m, how much activity do we have after two hours given that the decay constant is λ = 3.21 x 10⁻⁵ S-1?
A = A0e-λt
A = 100e-3.21 x 10-5 x 7200
A = 79.36 MBq
The ideal characteristics of the radio-labeled chelator:
There are two main ways of producing radionuclides in hospitals, either through direct (nuclear reactor or cyclotron) or indirect (generators) means.
Many parent radionuclides go to a ‘metastable’ state through beta or alpha emission. Metastable daughter loses excess energy as a gamma photon to revert to ground state. Most common radionuclide in Nuclear Medicine is a metastable isotope Tc-99m (6.01 hour decay) which is the beta-emission ‘daughter’ of Mo-99 (66 hour decay).
A generator has an eluate (collection) vial at low pressure containing saline. A pressure difference draws saline into a column containing Mo-99 on Alumina beads. The saline washes off Tc-99m into eluate vial. Sodium Pertechnetate (NaTc04) ends up in the eluate. There is lead shielding all around the generator to protect the technicians. Special calibration equipment is used to determine whether the strength of the radioactivity is correct.
The organ/tissue of interest will determine the choice of radiopharmaceutical to be used.
| Radiopharmaceutical | Primary Use |
|---|---|
| Tc-99m HDP (phosphor based) | Bone Imaging |
| Tc-99m MAG3 | Renal Imaging |
| Tc-99m MAA | Pulmonary Perfusion |
Nuclear medicine scanners have advanced tremendously since their invention in 1950. A gamma camera is suspended above a patient obtaining a 2D image from a 3D distribution of radioactivity.

The scintillation crystal absorbs energy from incident gamma radiation giving out corresponding photons so we can detect the intensity of the radiation as light. Key properties of a scintillation crystal are:
Typical scintillator crystals are NaI(TI)
The incident light photon from the scintillation crystals travels into the photomultiplier tube forcing electron emission from photocathode. The electron is focused onto first dynode which is at a higher potential than the focusing electrode causing the electrons to gain kinetic energy. The kinetic energy of the electrons is absorbed further in the dynode, freeing even more electrons in the process. This is repeated over 10-15 dynodes each at a higher potential. The pulse of charge is collected at the anode.

Photomultiplier tube size is 50 - 75mm
Gamma rays are emitted in all directions from the patient, and in order to determine their location of origin a collimator is used. A collimator can be thought of a very tiny bunch of straws, and they have many different designs including parallel hole (most common), pin-hole, converging and fan-beam. The different designs stop the scattered photons in different ways depending on what imaging is required and many different factors have to be taken into account:
However a collimator reduces the sensitivity of a detector system. The higher the resolution, the lower the sensitivity as more photons are absorbed by the collimator. Also collimators cannot avoid picking up scattered photons but these effects can be reduced by using energy discrimination of pulse height analysis. Without collimators intrinsic position calculation is ~3mm Full Width at Half Maximum (FWHM).
$ Energy \ Resolution = \frac{FWHM \ \times \ 100}{Peak \ Energy}\% $
| Energy keV | FWHM keV | Energy Resolution |
|---|---|---|
| 140 | 14 | 10% |
| 240 | 20 | 7% |
| 560 | 28 | 5% |
Note: FWHM is full width of a peak at half its height.
Scintillation detectors are bulky and have a relatively poor energy resolution. Recently some new Nuclear Medicine systems uses solid state semi-conductor detectors instead. These have a superior energy resolution, smaller and slim, costly are made up of substances such as Cadmium Zinc Telluride.
Avalanche Photodiode is an alternative to the photomultiplier tube, with a semiconductor detector sensitive to light photons. These are smaller, more compact, have a high quantum efficiency but are noisy and have a low timing resolution.
X and Y position signals are converted to digital form with analogue to digital convertor. The address memory location is incremented. The final image is then displayed on a standard computer display. There are many different parameters which determine the characteristics of the output image:
The distribution of the radiopharmaceutical is fixed over the imaging period. The gamma camera is positioned over the area of interest for a fixed time and counts are accumulated. Multiple images from different angles can be acquired (e.g. anterior, posterior, oblique)
Consecutive images are acquired over a period of time. The camera is in a fixed position allowing visualisation of the changing distribution of the radiopharmaceutical in the organ of interest.
There are lots of limitations with planar images as they represent a 3D distribution of activity. Depth information does not exist and structures at different depths are superimposed. Loss of contrast in plane of interest is due to underlying and overlying structures. Tomographic images find a cross-section and can be more useful and prevent some of these limitations.
A set of angular projections of the activity distribution within the patient are acquired by rotating the gamma camera(s) around the patient. Images are reconstructed using filter back projection and iterative reconstruction. Some parameters that affect SPECT acquisitions include:
This uses positron emission radionuclides (e.g. F-18, O-15, C-11). When these radionuclides interact with tissue they emit two 511 keV gamma rays. These gamma rays are emitted at 180° to each other and are detected in coincidence, improving the sensitivity. Just to compare a collimated single photon system has an absolute sensitivity of ~0.05% compared to ~0.5 - 5% of PET. The main application of PET is in oncology (study and treatment of tumours).
Here is a list of limitations of nuclear medicine, with the main ones highlighted in bold:
Two lesions with identical uptake but in different locations, will not have the same contrast. As the positrons emitting from one lesion will have to further than the other losing more energy and getting absorbed in the process. In order to resolve this a hybrid system is used, where SPECT/PET is used in combination with a low-dose CT. The information from SPECT/PET is overlaid the CT scan, showing exactly where in the body a disease is located.
Nuclear medicine is involved in more than just imaging procedures.
It is oral, intravenous or intra-cavity administration of unsealed radioactive source for the preferential delivery of radiation to tumours.
In therapy, Ɣ-emitters would not treat a tumour*, just pass straight through it. Therefore β-emitters, α-emmiters and Auger electrons are more desirable as their effects stay localised to the tumour. Therapy radionuclides have a longer half-life than imaging radionuclides, as you want them to stay active for longer (usually days) and keep treating the tumour until it goes away. Therapy radionuclides also have a high activity and a mild toxicity (Nephrotoxicity, Bone marrow toxicity)
*However some therapy radionuclides are also Ɣ-emitters so they can be imaged at the same time
An example of a radionuclide is I-131 which is used for thyroid carcinoma. It has a very high activity greater than 1100 MBq and can go up to 10-20 GBq. The patient is usually discharged when activity is below specific limits (usually 800 MBq). Patients are advised to drink plenty of water and usually have a scan just before discharge.
SIRT is used in inoperable liver cancer. Glass micro skewers (the size of red blood cells) contain radioactive materials. These are implanted into a liver tumour via an intra-arterial catheter placed into the hepatic artery under fluoroscopic control by interventional radiologist. They are not metabolised or excreted and stay trapped permanently in the liver. They decay with a physical life of 90Y. Its administered activity is about 3 GBq and delivers doses from 200 - 600 Gy.
The sentinel lymph nodes (SLN) are the first lymph node(s) to which cancer cells are likely to spread from the primary tumour. SLN biopsy is used to determine the extent or stage of cancer. Because SLN biopsy involves the removal of fewer lymph nodes than standard lymph node procedures, the potential for side effects is lower. The best practice is to use combined techniques of injecting blue dye and radioactive tracer. The procedure involves the injection of radioactive tracer 99mTc-Nanocolloid. 40 MBq if injected the day before surgery (preferable). 20 MBq if injected on the day of surgery.
SLN procedures are mostly used for breast cancers
This is where adult patients are injected with 10ml (2 MBq) of Chromium (Cr-51), and three blood samples are taken 2, 3 and 4 hours post the injection. The samples are then centrifuged with causing the plasma to separate from the red blood cells. Here we are looking at the renal function so the plasma is then sampled and counted with gamma counter. If the counts decrease after every hour then that shows that the patient has good renal clearance.
Learning Objectives
- Nuclear Spin
- Magnetic Field and Magnetism
- Resonance Effect, Excitation, Signal Reception
- Image Formation (Gradients, k-space and spatial encoding)
MRI is 30 000 times stronger than the Earth’s magnetic field. There are lots of advantages and disadvantages of MRI:
| Advantages | Disadvantages |
|---|---|
| Excellent soft tissue contrast | Little/no signal from boney structures |
| High Resolution | Time-consuming |
| Versatile | Complexity of acquisition/processing |
| Non-ionising (no long-term effect) | Uncomfortable (Noise/Claustrophobia) |
| Can scan healthy volunteers | Some patients contraindicated |
| Safe if used appropriately | Expensive |
| Large FOV | Artefacts from motion/metal |
| Imaging in any plane | Unsafe if not used appropriately |
An electron orbits the nucleus and is essentially a loop of current. This loop of current creates a perpendicular magnetic field known as a magnetic moment.
The Stern-Gerlach experiment is where silver atoms are fired out and pass through a non-uniform magnetic field to a screen. Originally the classical theory predicted random orientation of angular momentum of silver atoms when they reached the screen. However quantum theory predicted the opposite, that the silver atoms land in two discrete orientations (now known as spin up, spin down). The results of the experiment agreed with quantum prediction not the classical one. The quantum property causing the deflection of silver atoms is known as the inartistic angular momentum or spin.
The following are a group of nuclei with no nuclear spin:
| Nucleus | Spin | Relative Sensitivity | Natural abundance (%) |
|---|---|---|---|
| 1H | 1/2 | 1.00 | 99.98 |
| 13C | 1/2 | 1.59 x10⁻² | 1.11 |
| 14N | 1 | 1.01 x10⁻³ | 99.63 |
| 15N | 1/2 | 1.04 x10⁻³ | 0.37 |
| 17O | 5/2 | 2.91 x10⁻² | 0.04 |
| 19F | 1/2 | 8.30 x10⁻¹ | 100 |
| 23Na | 3/2 | 9.25 x10⁻² | 100 |
| 31P | 1/2 | 6.63 x10⁻² | 100 |
Not only is Hydrogen extremely sensitive to magnetic fields but it is also the most abundant element in the human body (as well as the planet!).
| Nucleus | Concentration (mM) |
|---|---|
| 1H | 90 |
| 13C | 0.3 |
| 14N | 0.06 |
| 39K | 0.155 |
| 19F | 0.001 |
| 23Na | 0.15 |
| 31P | 0.005 |
The most common isotope of hydrogen (1H) is simply a single proton. It is the most sensitive to external magnetic fields (42.56 MHz T-1), therefore almost all biomedical MRI makes use of 1H nuclei. Other nuclei are studied in MR Spectroscopy.
In the presence of an external magnetic fields, the spins tend to align either parallel or anti parallel, with a small bias towards the parallel (low-energy) state.
Note: How magnetisation is sensitive to temperature, easier to increase the magnetic field than keep the patient cool
Because of this slight bias, the patient will have a net magnetisation (very small). If all these magnetisation elements are added together they become the ‘bulk’ magnetisation vector.
| Magnetic Field, B0 (Tesla) | Spins aligned (ppm) |
|---|---|
| 0 | 0 |
| 1.5 | 10 |
| 3.0 | 20 |
As you can see, the degree of magnetisation is tiny, but at just 20 ppm (protons per million) this is enough to make detailed images of the body.
Clinical MRI scanners have field strength of 1.5 T or 3 T usually. The Earth’s magnetic field is ~50 µT. Ferromagnetic objects can become missiles at 0.3 mT and active implants such as pacemakers can fail at 0.5 mT.
This is where, like the Earth’s axis, each spin is tilted slightly away from the bore’s magnetic field. This leads to a precession around the bore axis at the Larmor frequency. This natural frequency is defined by field strength and is also known as the resonant frequency.
A second temporary (B1) magnetic field is turned on perpendicular to the main B field. This short pulse at the resonant (Larmor) frequency flips the M (magnetisation) vector into the transverse plan towards the higher energy anti-parallel state. The degree of the flip angle, α, is defined by the length and amplitude of the pulse.
The flipped M vector now has two components, Mz (still exists, but can go to zero) and Mxy transverse magnetisation (which didn’t exist before). This movement of transverse magnetisation produces the change in magnetic field. However now Mz and Mxy want to return to their original state, a process known as relaxation.
The relaxation of the two Mz and Mxy components are separate, and during the process causes induced current in the RF coil.
Note: usually the same RF coil produces the pulse and picks up the change in magnetic field, although they can be different
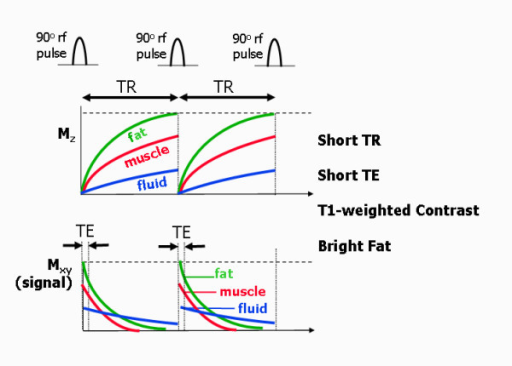
Mz wants to return to the parallel state, its full peak to M0. This is an interaction of the hydrogen spin with the lattice surrounding it. Depending on the lattice structure around the spin, the relaxation happens at different exponential rates. Relaxation of Mz tends to 63% ($ 1-\frac{1}{e} $). Different tissue types have different T1 values with fat having the fastest rate, then Muscle, with Blood being the slowest.
$ M_z = M_0(1-e^{\frac{-t}{T_1}}) $
Mxy wants to disappear through decoherence or dephasing. Mxy is at a maximum when the flip angle is at 90° This is a result of spin-spin interaction, i.e. hydrogen nuclei with other hydrogen nuclei. Again different tissue types have different T2 values with Mxy starting at 37% ($\frac{1}{e} $).
$ M_{xy}(t) = M_{xy}(0) e^{\frac{-t}{T_2}} $
| Tissue | T1 @ 1.5 T (ms) | T1 @ 0.5 T (ms) | T2 (ms) |
|---|---|---|---|
| Muscle | 870 | 600 | 47 |
| Liver | 490 | 323 | 43 |
| Kidney | 650 | 449 | 58 |
| Spleen | 780 | 554 | 62 |
| Fat | 260 | 215 | 84 |
| Grey Matter | 920 | 656 | 101 |
| White Matter | 790 | 539 | 92 |
| CSF | 4000 | 4000 | 2000 |
| Lung | 830 | 600 | 79 |
Notice that T2 is largely insensitive to field strength. CSF takes the longest time to relax because it is the most liquid, having free movement and little time for interaction with the lattice or with other spins
Faraday’s law means that a fluctuating magnetic field will induce currents. Receiving RF coils are tuned to the expected signal from the rotating M vector. Electronic components (ADC, bandpass filtering, gain etc) digitise signal for image formation.
Any electrically-conductive material exposed to RF will have currents induced, leading to resistive heating. Heating of the body is measured in W/kg, aka SAR (Specific Absorption Rate). MR scanner estimates SAR for every sequence and this is limited by FDA/IEC regulations
At 3T effects can occur in current loops as small as 30cm, such as the touching of arms and or legs with the body. Therefore patients are advised to touch their body parts together. Otherwise, the patients may get burnt at the point of contact as there is an increase in resistance at that point, causing the skin to warm up.
While the main magnetic field of the scanner (B0) cannot change, we can add additional, smaller magnetic fields with changing electrical fields. As you may remember from physics, a changing electrical field produces a magnetic field; this is the basis of electromagnets. Each MR scanner has 3 sets of spatial encoding electrical coils to produce magnetic fields in the x, y, and z directions. These coils can be adjusted to produce not a constant field but a gradient, in other words a magnetic field that changes in strength depending on your position.
These magnetic fields are much weaker than B0 and vary linearly across the x, y, or z direction. They can even be turned on in combinations to create a linear gradient in any arbitrary direction, ‘tilted’ in space. By the Larmor equation, f = γ * B, so that if the magnetic field varies across space, the precession frequency of the protons will vary as well.
The thickness of the slice is determined by the intersection of the gradient and the bandwidth. A region of spins are excited by an RF pulse. The thinner the slices the less signal you receive resulting in worse image quality. A bit like when you cut an onion in two it becomes a bit see through, there is not enough there.
The white plots in the middle of the K space (frequency domain) are low frequency, and slowly varying. There is conjugate symmetry in the K space matrix.
K Matrix size: 256 x 256 = 256 samples and 256 phase-encoding steps. Fourier Transform of K-space returns matrix in image space of exact same size. For a fixed field of view, increasing the matrix size increases the resolution.
Time-varying magnetic fields induce currents in electrically conductive materials. This can lead to nerve stimulation. The Control of Noise at Work Regulations (2005) require that hearing protection is available if staff noise exposure exceeds 80 dB(A). Groups of particular concerns are children and neonates, the foetus, unconscious patients, and those with pre-existing hearing problems.
Localisation is performed by spatially varying the phase and frequency of a frequency-selected slice.
A pulse sequence is a series of RF and gradient field pulses used to acquire an MR image. Altering pulsed fields timing and strength, results in changes to the information content of the resulting image. Different pulse sequences are designed to encode different kinds of information into NMR signal.
This is a sinusoidal wave which oscillates a Lamor frequency. The signal received from the RF coil is a function of the precession and decay of the transverse magnetisation. Measuring T2 from the FID is difficult due to the technical limitations. The transverse magnetisation is ‘refocused’ in order to produce an echo.
$ M_{xy}(t) = M_0 exp(iw_0 t) \dot exp \bigg( \frac{-t}{T_2} \bigg) $
The signal received from the RF coil is a function of the precession and decay of the transverse magnetisation. Measuring T2 from the FID is difficult due to the technical limitations. The transverse magnetisation is ‘refocused’ in order to produce an ‘echo’.
The spin (RF) echo refocuses relaxation due to inhomogeneity but not spin-spin interactions. Gradient echo uses the gradient not, NOT RF, to refocus FID but cannot undo the effect of inhomogeneity. The transverse magnetisation is ‘refocused’ in order to produce an ‘echo’.
Echo is produced by inverting the FE gradient. Flip angle usually less than 90, leads to faster imaging and reduced SAR (Specific Absorption Rate). Sensitive inhomogeneity, can be plus or negative depending on the context.
| Image Contrast | TE | TR |
|---|---|---|
| Pure p-weighted | Very short | Very long (3x T1) or small flip angle |
| T1-weighted | Very short (~3-30ms) | Appropriate flip angle |
| T2-weighted | Relevant (e.g. TE=T2) | Very long or small flip angle |
The echo time (TE) represents the time from the center of the RF-pulse to the center of the echo. For pulse sequences with multiple echoes between each RF pulse. The repetition time (TR) is the length of time between corresponding consecutive points on a repeating series of pulses and echoes.
Which equation describes the Larmor frequency of a magnetic moment exposed to an external magnetic field?
What mathematical technique is required to transform a signal from the time domain into the frequency domain?
Fourier Transform
Which of these is NOT an advantage of MRI over CT?
Which nuclei is the primary nuclei studied in biomedical MRI
1H
At what field strength to ferromagnetic objects become a missile risk?
3mT
Which tissue has a very long T1 relaxation time?
CSF
What risks are associated with the RF coils?
Heating of the body
What is the image size of an MRI slice if the K-Space matrix is 128x128?
128x128
What impact on SNR does halving the slice thickness (delta z) have on the SNR?
It halves the SNR, but increases spatial resolution in the z direction.
In an axial conventional spin echo image of the brain, the skull fat is brightest, followed by the white matter, followed by the gray matter. The CSF is dark. What weighting does this image have?
T1
Generally, how is the SNR different in SE (Spin Echo) vs GRE (Gradient Echo)?
SNR is higher than in GRE.
Learning Objectives
- Describe the fundamental interactions of sound with tissues
- Explain the difference between reflection and scattering
- Calculate the amplitude and power, reflection and transmission coefficients, when supplied with appropriate acoustic impedance values
- Explain the origin of speckle in ultrasound images
- Describe the basic modes of operation of an ultrasound scanner and the information they provide
- Have a basic understanding of the key factors affecting spatial and temporal resolution
- Calculate the Doppler shift associated with scattering from a moving target and calculate the speed of a target given a measured Doppler shift
- Describe and explain a range of common artefacts that affect ultrasound imaging and be able to provide techniques for avoidance.
- Explain the potential biohazards of ultrasound imaging and describe the indices that are used to guard against these.
Ultrasound imaging is transmission of high frequency sound into the body. It involves the detection of echoes and signal processing, leading to the parametric display of returning echoes.
Ultrasound has widespread medical applications as it is safe (non-ionising radiation), relatively cheap and portable and versatile. It is particularly useful for imaging soft tissues especially in the context of preclinical studies, to see the anatomy and/or function.
Resolution is proportional to frequency, as the higher the frequency, the higher the resolution. Also penetration into the body is proportional to the frequency, lower frequencies penetrate deeper into the body.
Note: There are also many industrial (non-medical) applications
The standard ultrasound is same size as a filing cabinet but it is on wheels. They have lots of controls as they lots of parameters that can be tweaked for the particular area than is to be scanned. The ultrasound scanner clinical transducer is the instrument that is used to produce and receive the ultrasound signal. The thickness of the active element is 0.4mm and produces a frequency of around 5.4 MHz.
There are many different modes of Ultrasound Imaging:
Sound waves are a form of mechanical energy (vibration) that propagates due to the motion of particles in the medium. The density and elasticity are the fundamental physical properties that determine how sound waves propagate.
Robert Hooke discovered that stress is proportional to strain (Hooke’s Law). Using this is relation to ultrasound:
$ \beta $ is the bulk elastic modulus, $ \frac{\Delta V}{V_0} $ is the fractional volume change
$ \frac{\rho - \rho_0}{\rho_0} $ is the relative change in density
As as sound wave propagates, energy is lost and At boundaries between different materials, it can be reflected, refracted, or scattered. Remember that sound rarely travels through completely homogeneous media.
Acoustic impedance is the ratio of push (local pressure) variable to flow (how fast particles are moving) variable.
$ Z_{sp} = \frac{p}{v} $
where Zsp is the Acoustic Impedance, p is the press and v is the particle velocity. Note how similar this equation is to $ R = \frac{V}{I} $
$ Z_{sp} = \frac{p}{v} = Z_{ch} = \rho_0 c_0 $
Special case of infinite plane wave. Where c0 is the speed of sound
Pulse waves are required for range finding. The length of the pulse affects the resolution, sensitivity and total energy derived.
At a boundary between two media, the pulse wave splits into transmitted and reflected components with power being conversed across the boundary.
$ r = \bigg( \frac{Z_2 - Z_1}{Z_2 + Z_1} \bigg)^2 \quad t = \frac{Z_1}{Z_2} \bigg( \frac{2Z_2}{Z_2 + Z_1} \bigg)^2 $
$ R = \frac{Z_2 - Z_1}{Z_2 + Z_1} \quad T = \frac{2Z_2}{Z_2 + Z_1} $
Scattering occurs when there are small inhomogeneities in wavelength as well as a possible local variation in density, elasticity and speed. This ends up causing the ‘speckle’ artefact in an ultrasound image. It is highly dependent on size and frequency.
There are many objects or particles per resolution cell. The random arrangement gives rise to incoherent scattering or specie noise. Speckle is a random, deterministic, interference pattern that is an inherent characteristic of coherent imaging. Its texture does not correspond to underlying structure, and the interference effect is superimposed on average scattering magnitude.
When sound passes through tissue some of the energy it possess’ is lost due to scattering and absorption. Absorption is the conversion of wave energy to heat, and is dependent on frequency.
The lost of energy is characterised using an Attenuation coefficient, in a logarithm scale with units in dB.cm-1.MHz-1. Note that it is frequency dependent, the higher the frequency the more energy you lose.
Sound is attenuated as it propagates (depth), the ultrasound machine automatically calculates the attenuation coefficient and adjusts the brightness on the display so it is an even image (i.e. not darker with the increase in depth).
Echo location is the timing of echoes providing depth information.
The Piezoelectric effect is how we generate the sound pulses in the machine. In some materials, when a potential difference is varied across them, the material will vary in thickness. This can be used to generate a high frequency vibration. Mechanical distortion leads to the imbalance of distribution of electric charge (the reverse effect is also true). As a result, the electric field is proportional to the strain.
Inside an ultrasound probe, there are hundreds of wires connected up to hundreds of independent transmitters and receivers in a linear array. Thos is desirable, as you want to make it possible for the operator to ‘steer’ the sound. A circular wavefront can then be formed to focus the beam, by firing of small ultrasound pulses from the different transmitters at different times. This manipulation of the beam is known as beamforming.
The transducer has a natural resonant frequency, however at this frequency the pulse is long. This is undesirable in ultrasound, so they are dampened to create shorter pulses. This dampening however is inefficient and energy is wasted. Ideally, pulse length (Tp) would be equal to the wavelength, however due to physical limitations it is always longer than a single wavelength. A larger frequency and a larger bandwidth improves resolution.
The range resolution ($ \Delta r $), which is the ability to distinguish two scatterers at different depths behind each other, is inversely proportional to the frequency.
$ \Delta r = \frac{cT_p}{2} $
Tp is the length of pulse in time, c is the speed of sound, $ \Delta r is the range resolution $
In the horizontal (lateral) direction a higher frequency, larger aperture and tighter focus all contribute to an improvement in resolution.
Is the precision of ultrasound with respect to time, and is represented by the following equation:
$ T = N.\frac{2d}{c} $
T = time per frame, N = liens per frame, d = depth, c = $ \sqrt{ \frac{\beta}{\rho_0}} $ = speed of sound
In ultrasound, the doppler effect occurs twice, the moving target receives and transmits the sound wave. The change in frequency is negative as the velocity towards the original source reduces separation and increases frequency:
c = speed of sound, V = target velocity, f = frequency
There is no Doppler effect when a target is moving perpendicular to the sound direction. Only the component of the target velocity along the axis of the wave direction contributes to the Doppler Shift.
If Ultrasound f = 5 MHz, Blood velocity = 0.5 m/s, Angle = 45°, Sound speed = 1540 m/s.
Note: We will be able to hear this sound, and sometimes doctors use this in their diagnosis.
Unfortunately there are many common artefacts in Ultrasound, however fortunately most of these can be avoided by moving the transducer:
Ultrasound contrast agents are designed so more scattering occurs, so more pulses are reflected and received. The problem is that Blood on an Ultrasound is dark/black. Microbubble contrast agent, a few micrometers in diameter, can provide a non-linear response to ultrasound. For example this can be helpful to visualise tumours in a liver.
The intensity of a plane travelling wave:
Energy lost per unit area, per unit distance and time:
Assume all energy is absorbed as heat. The heat energy, assuming no heat is lost via conduction, convention or radiation is represent by:
$ \rho $ is the density, C is the specific heat capacity, and $ \Delta T $ is the change in temperature. Remember that I is the energy per unit time: $ \frac{dQ}{dt} = \mu I $
However heat is transported away via tissue perfusion.
Acoustic cavitation is the formation, motion and effects of acoustically driven cavities in fluids. It involves the tearing apart of the medium due to low pressure (i.e boiling).
Inertial cavitation refers to the sudden collapse of a cavity in the compression phase. It is governed by the inertia of the surrounding medium. Acoustic shock wave, High temperatures ~1kK, production of light. It is a very localised effect and free radicals are created.
Non-Inertial cavitation refers to stable oscillation of a cavity during isolation. This includes effects associated with motion of the surface and gas diffusion.
These are two guidelines which a clinician uses which air on the side of caution:
The thermal index is intended as a measure of an ultrasound beam’s thermal bioeffects.
$ TI = \frac{W}{W_{deg}} $
$ W_{deg} $ is the acoustic power required to raised temperature by 1°C (steady state), $ W $ is the current power output. Note TI is not an indication of actual temperature rise. Different models are used to calculate TI for soft tissue, bone (at focus), and cranial bone
The MI indicates the possibility of mechanical damage to the tissues as a result of cavitation. It is based on the analysis of pressure required to initiate inertial cavitation. It is a most basic level this index gives an idea of changes in acoustic pressure level with output power. Above 0.7 there is a theoretical risk of cavitation.
$ MI = \frac{P_{-ve}}{\sqrt{f}} $
$ P_{-ve} $ is the peak negative acoustic pressure. $ f $ is the ultrasound frequency. MI is not a probability. Pressure is derated by assumed attenuation in tissue.
Learning Objective
- Basic Function of the Heart
- Physiological Measurements
- Heart Electrical Stimulators
- Basic Electrical Safety
The heart is the pump station of the body and is responsible for circulating blood throughout the body. It is about the size of a clenched fist and sits in the chest cavity between the two lungs. Its walls are made up of muscle that can squeeze or pump blood out every time that organ “beats” or contracts.
Fresh, oxygen-rich air is brought to the lungs through the trachea or every time that you take a breath. The lungs are responsible for delivering oxygen to the blood, and the heart circulates the blood to the lungs and different parts of the body.
The heart beats’ about 100,000 times in one day and about 35 million times in a year. During an average lifetime, the human heart will beat more than 2.5 billion times. The body has about 5-6 litres of blood around it three times every minute. In one day, the blood travels a total of 19,000km. The heart pumps about 1 million barrels of blood during an average lifetime - thats enough to fill more than three super tankers!
The human heart consists of four “chambers” - two atrial and two ventricular cavities which are separated by muscle walls and valves. The main function of the heart is to be a pump but actually it acts as a double pump - right and left. The right pump sends blood into lungs for oxygenation. The left pump supplies the whole body with oxygenated blood (it is more powerful). Together with muscle cells, the heart wall contains specialised cells which form a network allowing an electrical impulse to spread through the heart.
The heart is composed of three major types of cardiac muscle: atrial muscle, ventricular muscle and specialised excitatory and conductive fibres. The atrial and ventricular muscles are very similar to skeletal muscle by its structure but the duration of contraction is much longer.
The heart structure includes a specific system for generating rhythmical impulses to cause rhythmical contraction of the heart muscle. The conductive system delivers these impulse rapidly throughout the heart muscle.
An action potential (AP) is a rapid change in the membrane potential during which the potential rapidly depolarises and repolarises. The potential reverses and the membrane becomes positive inside. AP provides long-distance transmission of information through the nervous system. Half or more of all smooth muscle contraction is initiated not by actions potentials nut by stimulatory factors acting directly on the smooth muscle contractile machinery. The two types of non-nervous and non-action potential stimulating factors most often are:
There are two major differences between the membrane properties of the cardiac and skeletal muscle:
The duration of the plateau ensures cardiac contraction which lasts 20 to 50 times longer than in skeletal muscle. The refractory period of atrial muscle is much shorter than for the ventricles (about 0.15 second) and the relative refractory period is another 0.03 second. Therefore, the rhythmic rate of contraction of the atria can be much faster than that of the ventricles.
The surface of cardiac muscle is oppositely polarised compared with inside cells
After imaging, physiological measurements are among the most important diagnostic methodologies used in health care.
The body fluids are good conductors, fluctuations in potential that represent the algebraic sum of the action potentials of myocardial fibres can be recorded from the surface of the body. The rocked of these potential fluctuations during the cardiac cycle is called ECG.
The phase of ECG formation, based on the changes of the summary potential (vector) of the cardiac surface. The bulk electrical activity of the heart produces a reasonable sized signal on the body surface, which can be measured by connecting electrodes to the skin. The recorded waveform and amplitude (1 mV) depends greatly on the position of the electrodes.
The P wave is caused by the atrial depolarisation prior to contraction.
The QRS complex (~ 1mV amplitude) is caused by currents generated when the ventricles depolarise prior to contraction. Therefore, both P wave and the components of the QRS complex are depolarisation waves.
The T wave is caused by currents generated as the ventricles recover from the state of depolarisation.
The yellow electrodes are attached to the left arm and the red electrodes to the right arm, green to the left leg and black to the right leg (ground electrode).
Horizontal and vertical calibration is made using a grid printed or display. The horizontal lines are the voltage, 10 small divisions upward or downward represent 1 mV. The vertical calibration lines represent the time, with each 2.5 cm representing a second. The standard speed is 25 mm/s.
There are many different heart abnormalities that can be picked up with an ECG:
The electrical activity of heart forms isopotential lines over the body surface, which assume various positions of ECG leads (with different signal waveforms).
As blood is pumped out of the left ventricle into the arteries the pressure in the aorta rises, the higher level being the systolic pressure. At the end of the left ventricular contraction, blood flows away from the heart so the aortic pressure falls. When the aortic valve closes, a notch appears on the pressure waveform. The lowest pressure is just before the next heartbeat, and is the diastolic pressure. The rate at which pressure falls depends on the systemic vascular resistance (SVR).
MAP - Mean Arterial Pressure, CO - Cardiac Output, SVR - Systemic Vascular Resistance, CVP - Central Venous Pressure
Mean Arterial Pressure (MAP) is the average pressure in a cardiac cycle. It is not the value halfway between systolic and diastolic pressures because the diastole lasts longer than systole (470 vs 330 ms).
In 1904 Korotkoff described the sounds that blood made as it moved intermittently through an artery when measuring blood pressure. The artery distal to the cuff is listened to using a stethoscope (auscultation method).
Measuring the ABP (arterial blood pressure) using the auscultatory enables the doctor to find a few different variables:
Systolic Pressure (SP) is the maximum pressure reached during peak ventricular ejection. Normal values at rest - between 100 and 140 mm Hg.
Diastolic Pressure (DP) is the minimum pressure reached during ventricular relaxation. Normal values at rest - between 60 and 90 mm Hg.
Pulse Pressure (PP) is the difference between the systolic and diastolic pressure. PP = SP - DP
Cardiac Pacemaker is an electric stimulator that produces periodic small electrical pulses to the heart (as from the AV and/or SA nodes). The stimulus aims to generate heart contraction (atrial and/or ventricular)
Approximately 500,000 new pacemakers are implemented each year and other 100,000 are replaced
There are two main types of pacemakers:
This is a fixed rate (asynchronous) pacemaker.
This is split into another two types, depending on the location. There are ventricular pacemakers that are either R-wave inhibited (demand) or R-wave triggered. And there are Atrial pacemakers that are usually P-wave triggered.
A Pacemaker has to work in synchrony with the heart natural pace, or to fully replace it. If it works in synchrony it has to detect the main heart rhythm (R wave) and, if R wave is there to inhibit the internal timer, but if it is different from the expected one, to generate a stimulus pulse (Feedback 1). The amplitude and duration of the stimulus electrical pulse can change to deliver the needed effect.
The pulse parameters depend on the the battery of the pacemaker. Feedback 2 constantly monitors the battery output and modifies the pulse parameters to deliver the needed effect. The pacemaker has to be protected from external strong electrical fields/pulses (e.g. Defibrillator). A number of leads (electrodes) deliver the pulse to the heart (same leads measure the heart activity).

Electrodes (either unipolar of bipolar) deliver a 1 millisecond pulse with 10 mA amplitude to the heart. The lead must survive constant flexing (30 - 40 million cycles per year) in warm, corrosive saline medium, therefore it is made out of platinum with 10% iridium alloy.
External pacemakers are for temporary arrhythmias and internal pacemakers are implanted for more permanent conditions.
The electrodes have a tissue resistance of ~500 Ω. Therefore using the P = I2R equation:
1 sec x 50mW will give average consumption of 50 μW per second (at 60 bpm). 10 mA flows for 1 msec - what gives an average of 10 μA per second.
The battery capacity (mAh) has to supply these 10 μAs for a number of years. Useful battery capacity divided to pulse charge 10 μAs will give the useful period of function (usually more ~ 10 years). This period depends on the type of use and the type of battery (i.e. lithium iodine cell).
A defibrillator is an electrical device that produces a strong electrical pulse to heart aiming at re-establishing a more normal cardiac rhythm.
Atrial Fibrillation is where the ventricles still function but with an irregular rhythm.
Ventricular Fibrillation is very dangerous as the pumping function of ventricles stops.
Defibrillators deliver large electric shocks to the heart aiming to restore a normal sinus rhythm: total stop of the heart which inhibits fibrillation in hope that the heart will re-start in an orderly rhythm. The position of the electrodes is crucial for this to work.
The resistance of the skin/electrodes is ~50 Ω and the current through the chest is ~ 50 A. Pulse duration is ~ 4 msec.

Inside the fibrillator is a capacitor which discharges itself over the heart.
There are three main types of defibrillators:
Implanted defibrillators (max 30 J) has a battery that is sufficient for ~ 100 shocks.
A macro shock is where a high current passes through the body with a small component passing through the heart. A micro shock is a low value current passing directly through the heart.
This results at all frequencies if the power density is high enough.
Alternating current stimulates muscles directly. Ventricular fibrillation threshold is high for short impulses (e.g. 2 A for 200 msec) but fails dramatically for pulse durations approaching 1/3 of the cardiac cycle). Stimulation can occur through the skin:
Direct heart stimulation - ventricular fibrillation threshold is very low (~60 μA at 50 Hz)
This takes places at electrode-tissue interfaces (even at d.c.). If a current of 0.1 mA d.c. passes through an electrode to jelly to skin for ~x minutes it can causes an ulcer.
In hospital electrical devices a ground wire takes leakage current proportionally to the difference of resistance ground/heart (in the case 10,000 times more μA). However if the ground wire is broken all 100 μA leakage current will go through the heart and a micro-shock occurs at 60 μA (50 Hz).
It monitors the balance of incoming and outgoing current flows (from Live and Neutral) and interrupts the circuits if an imbalance is detected.
Learning Objectives
- What is Non-Ionising Radiation
- Sources of non-laser optical equipment in healthcare (phototherapy and dosimetry)
- The body that advises on Non-Ionising Radiation (NIR) protection
- The hazards of NIR
- UK Regulations
- Examples of Exposure Calculation
NIR is radiation that does not produce ionisation. In healthcare the term is largely used to indicate both electromagnetic radiation and ultrasound (mechanical energy). Usually the wavelengths are greater than 100nm.
Electromagnetic radiation is made by quanta, i.e. photons. Each photon carries a finite energy (E) dependent upon the frequency (v) of the EM wave.
where λ is 100 nm, h = 6.626x10⁻³⁴ Js (Planck’s constant), C = 3x10⁸ ms-1 (speed of light)
The minimum energy required for ionisation is about 12 eV. Photons need v < 100nm to have such energy.
There are two types of NIR, laser and non-laser radiation:
This is broad band optical radiation, produced by spontaneous incoherent emissions of excited materials (i.e. Gas, Semiconductors junctions).
Phototherapy units exploit UV light (mostly fluorescent tubes) to treat skin diseases such as psoriasis. They work by interacting with the immune system and mechanisms of skin regeneration.
Different wavelengths have different penetrations in the skin and are more suitable for different diseases. The cabins are the most common Phototherapy units, or there are treatment beds for longer treatments. Hand and Foot units are used for partial disease or to top up radiation. The hands and feet are often used to exposure to NIR (from the sun) so need a higher dosage. There is also a comb unit if a disease is present on the scalp of a patient’s head.
Examination lights use both UV and visible lights. They can use a variety of light sources: UV compact fluorescent tubes, halogen and LED lights. The region of emission will depend on the specific source used.
Therapeutic sources that exploit the specific interaction of blue light with either the body or the materials (dentistry). They can used fluorescent, halogen or LED sources.
Other typical non-laser sources include Infra-red used in Gate analysis
Ultraviolet (UV) light is used to treat skin diseases. There are different spectra available. A dermatology consultant will recommend the use of one of them after assessing the patient. The starting treatment dose is chosen on the basis of the patient’s skin type or a test dose or (better) both. Phosphor coating on materials can be selected to obtain different spectral outputs.
Typical phototherapy lamps emit the following spectra:
The longer the wavelength of UV light the further it penetrates into the skin
The light dose for patients exposed to a UV phototherapy source (D), is estimated in terms of radiant energy received for unitary surface and measured in Jm-2 (or often in practice as mJcm-2). The dose (D) can be calculated by the knowledge of a source irradiance (E) and patient exposure time (T).
$ D = ET $
D (Jm-2), E (Wm-2), T (s)
This is a non-profit independent body that disseminates information and advice on potential on potential health risk linked to non ionising radiation (NIR). It has a main commission of 14 scientific experts with 4 standing committees (7 members):
Heff = 30 Jm-2 in 8hr (eye, skin)
HUVA = 104 Jm-2 in 8hr (eye - lens)
(ICNIRP - 2010)
Optical radiation can undergo transmission, reflection, refraction, diffraction, adsorption, scattering. UV photons above the ionisation energy can disrupt atoms and molecules. UV photons below the ionisation energy are strongly absorbed in producing electron transitions.
Exposure to UV can affect either the skin or the eyes. UV radiation produces photochemical damages. The photons absorbed have enough energy to induce modifications into the molecules.
Exposure to intense visible light can cause retinal damage. The hazard is highest at those wavelengths the photoreceptors of the retina are most sensitive to 450-550 nm.
| Wavelength nm | Part of the body | Hazard |
|---|---|---|
| 180 - 400 (UVC, UVB, UVA) | Eye (cornea, conjunctiva, lens), Skin | Photokeratitis, Conjunctivitis, Cataractogenesis, Elastosis, Skin Cancer |
| 315 - 400 (UVA) | Eye (lens) | Caractarctogenesis |
| 300 - 700 (Blue light) | Eye (retina) | Photoretinitis, Retinal burn |
| 780 - 1400 (IRA) | Eye (cornea, lens) | Retinal burn |
| 780 - 3000 (IRB) | Eye (cornea, lens) | Corneal burn, Cataractogenesis |
It shall be the duty of every employee while at work to take responsible care for the health and safety of himself and of other persons who may be affected by his acts or omissions at work.
This refers to the ICNIRP guidelines on exposure: - Wavelength dependency of the hazards - Maximum exposure for specific bands of emissions
The employer must eliminate or reduce any risk related to exposure to optical radiation. Staff exposure to non-coherent optical radiation must be below Exposure Limit Values (ELVs) specified in Annex I of the AORD.
The wavelength dependency of the optical hazard is described by hazard Action Spectra (AS). The ICNIRP adopts 2 spectra for UV, one for blue light damage and one for thermal damage.
$ MET = \frac{b}{E} $
MET is Maximum Exposure Time (s), b is the guideline limit (Jm-2), and E is the Exposure produced by the unit (mWm-2)
Non-laser optical equipment uses what time of radiation and what are the range of emissions?
Broadband radiation wth emissions between 100nm - 3mm
Name four typical non-laser optical sources in healthcare
Phototherapy UV lights, diagnostic lights, blue light units and infrared thermometry
Who is the body that advises on NIR hazards?
ICNIRP
What are the organs exposed to NIR optical radiation?
Skin and Eyes
What is the specific UK regulation on UV?
The Control of Artificial Optical Radiation at Works 2010 is the specific UK regulation
Learning Objectives
- The physics and different modes of operation of lasers
- Laser classification
- Quantifying laser hazards
- Protective eyewear
- Laser interactions
We are interested in the following portion of the electromagnetic spectrum, regarding lasers:
| UV | Ultraviolet | 200 - 400 nm |
| VIS | Visible | 400 - 700 nm |
| NIR | Near Infrared | 700 - 1400 nm |
| MIR | Middle Infrared | 1400 - 3000 nm |
| FIR | Far Infrared | 3000 nm - 1mm |
Lasers created from an artificial optical coherent radiation source were first invented in 1960 by Maiman. LASER is an acronym for:
The basic components of a laser are:
Atoms in the losing material exist initially in the ground state with energy A.
An energy source source provides energy to the lazing material and *raises atoms from the ground state (A) to an excited state (A)** by a process called stimulated absorption. The energy required is A* - A, and the value of this depends entirely on the lasing material and determines the wavelength of the laser.
The majority of the atoms in the lasing material are in the excited state.
Atoms spontaneously decay back to the ground state, emitting photons with random phase & direction.
The “trigger photon” from spontaneous emission (with energy A* - A) encounters excited atoms from the lasing material. The excited atom is forced to emit a photon with identical direction & phase (i.e. wavelength) than the “trigger photon” leading to amplification.
A lasing material is encased between two mirrors inside a laser cavity. An energy source excites the lasing material that emits photons. A back mirror is fully reflective & a front mirror is partially transmitting to allow photons to exit the laser cavity. The laser beam can only emerge when the shutter is opened (i.e. foot/hand switch activated). Beam delivery device directs the beam to its final destination. A cooling system is also required to maintain output level.
The laser energy is transferred to the treatment site in one of two ways:
This hollow articulated arm has mirrors (highly polished stainless steel) at elbows. The beam alignment is crucial.
This uses reflections to trap the light inside (total internal reflection). Light rays can travel along glass or plastic fibres. The laser will lose it’s coherence (this has no significance for treatment purposes).
Lasers have many different useful properties:
When treating a patient then the method of laser light delivery is very important:
Laser outputs tend to take into account the area of the beam as this is key to the effect the beam has on the surface. There are two main types of lasers, continuous and pulsed:
For a continuous wave laser, power ($ \frac{energy}{time} $) is the most useful measurement, and its units are Watts (W). Irradiance takes into account the area of this power and it is measured in W/cm2
For a pulsed laser, energy is the most useful measurement, and its units are Joules (J). Radiant exposure (dose) takes into account the area of this energy and is measured in J/cm2.
Radiant Exposure (J/cm2) = Irradiance (W/cm2) x time
Some of the properties become important when treating a patient.
If no chromophore (an atom or group whose presence is responsible for the colour of a compounds) all photons will pass through the tissue without any effect. There will be total transmission. Selection of proper chromophore in or near the target is the first important step.
This occurs at all interfaces of media, such as air, water, skin surface. Skin reflects 4% to 7% of visible light. To reduce reflection have firm contact with skin, light guide, US jelly, holding hand-piece perpendicular to the skin surface.
This occurs predominantly from inhomogeneities in structures whose size is similar to the wavelength or slightly larger i.e. collagen fibres. It is the inverse function of wavelength. A shorter wavelength equates to greater scattering. The greater the scattering, the less depth of penetration and more possibility of absorption.
Other factors also have a bearing on the depth of penetration. In tissues, more scattering occurs when a small spot size is used. With a large spot size, photons hit each other and are recollected and redirected downward increasing the depth of penetration.
A laser manufacturer is responsible for assigning all laser products to one of seven general hazard classes defined in BS EN 60825-1:2007:
| Class | Laser Type | Potential eye/skin hazard |
|---|---|---|
| 1 | Laser completely enclosed or Very low power level | Safe under all conditions in normal use |
| 1M | Low power level & large collimated beam diameter | Safe except when magnifying lenses are used |
| 2 | Low power level (<1 mW), Visible wavelengths only | Safe under accidental exposure (Blink reflex of 0.25s) |
| 2M | Low power level & large collimated beam diameter, Visible wavelength only | Safe under accidental exposure (Blink reflex of 0.25s) except when magnifying lenses are used |
| 3R | Low power level (<5 mW) | Accidental exposure not hazardous but eye injury possible for intentional exposure |
| 3B | Medium power (<500 mW) | Direct beam dangerous to eye, Diffuse/scattered light safe |
| 4 | High power (>500 mW) | Direct and diffuse/scattered light dangerous to eye & skin, Fire hazard |
Access to areas in which Class 3B or Class 4 lasers are used must be marked with warning signs.
This determines the classification of a laser or laser product. It depends on how much access an individual has under normal operating conditions, for example:
Maximum exposure level to laser radiation that (in normal circumstances) should not injure the eye or skin. Data and equations are given in BS EN 60825-1:2007
It is at a different value for the skin and the eyes. MPE can be stated in two ways discussed earlier:
If the exposure time is known then its possible to convert between the two
For example, imagine a diode laser with a wavelength of 689 nm. It has a power output of 4 mW, a beam diameter of 3mm and is a continuous wave. First the area of the beam is calculated:
From this the irradiance at the laser exit (neglecting divergence) can be calculated:
A more complicated calculation is irradiance to the eyes. The limiting aperture over which the average irradiance for an eye exposure would be 7mm. First the area of the eye aperture is found:
Then the average irradiance to the eye is calculated:
The diode laser emits in the visible range at 689 nm so the blink reflex response needs to be taken into account. At this value the MPE is 18 t0.75 C6 Jm-2. This values is found from a table when t is blink response time of 0.25 s and C6 is the correction factor (this is 1 for our purposes).
Combining all these values the MPE at the cornea works out to be 6.36 Jm-2 or 25.3 Wm-2. These MPE values are clearly exceeded by our previous calculations of 103.9 Wm-2 therefore safety eyewear would be required.
Note: if the laser is invisible, then you can’t use the blink response time of 0.25 s. In this case, 10 seconds is generally used instead.
This is the distance from laser aperture at which it would be safe to view the laser without safety glasses, when the laser output is below the MPE level. This can range from ‘cm’ to hundreds of metres and depends on the output level and type of laser. As the beam size gets larger, the area that the power is divided over gets bigger and so the irradiance gets smaller. At a certain distance, the irradiance will equal the MPE and this is called the Nominal Ocular Hazard Distance (NOHD).
In order to determine NOHD the following equation is used:
$ NOHD \ (m) \ = \ \frac{\sqrt{\frac{4 \times Power}{\pi \times MPE} \ - \ aperture \ diameter }}{Divergence} $
Radiant power (W), Aperture diameter (m), Divergence (radians), Maximum Permissible Exposure level (Wm-2)
Persons standing at a distance closer than the NOHD should wear adequate protective eyewear. It is designed to reduce worst case accidental viewing conditions to a ‘safe’ level (blink reflex applies). Protection level is reduced when beams are focused to small spot sizes (as encountered in medical applications)
This represents a measure of the transmission of an optical medium for a given wavelength. It is a logarithmic scale:
OD5 results in a reduction in transmission by 105 (100 000 times). OD5 is usually high enough as it reduces a 100 W laser beam to 1 mW.
Note: the optical density fails to explain how long it will offer protection for
This takes into account both optical density & damage threshold of a material. This guarantees protection from direct beam for only 5 secs or 50 pulses under specific test conditions. L-number indicates protection level and this varies with mode of operation and wavelength.
| Laser mode | Wavelength range (nm) | Protection Level |
|---|---|---|
| D | 180 - 315 | L10 |
| IR | 180 - 315 | L5 |
| D | 315 - 532 | L6 |
| I | 315 - 532 | L7 |
| R | 315 - 532 | L5 |
| DIR | 1045 - 1100 | L7 |
D - Continuous, I - Pulsed, R - Q switched (v. short powerful pulses)
The interactions that lasers have with biological tissues depend on three main parameters:
The location and level of absorption of laser radiation is strongly wavelength dependent. The interaction effects can be roughly grouped into the following processes:
Photochemical damage can occur for lower irradiance that are not high enough to cause thermal damage (i.e. too small to cause a temperature rise). Examples include skin tanning, psoriasis treatment, new born jaundice treatment, sunburn, skin cancer and cataracts.
Above a critical tissue temperature, proteins are de-natured and thermally induced damage occurs. At temperatures of 60°C, coagulated tissue becomes necrotic. Once temperatures are greater than 100°C, water in the tissue begins to boil. Further temperature increases lead to carbonisation.
Carbonisation should be avoided since the tissue will die at lower temperatures and it reduces the visibility of a target during surgery. To avoid carbonisation, the tissue is usually cooled using water or gas. Examples of thermal effects include coagulate, cut & burn and heat.
On the surface of a tissue such as the cornea for UV and far IR wavelengths, thermo-mechanical effects lead to ablation of material. The heated material is rapidly removed from the rest of the material which is hardly affected by the process.
The depth of tissue removal is determined by the pulse energy. Advantages of this procedure are the precision of etching and the fact that no thermal damage is caused to the surrounding tissue.
UV photons (typically Excimer lasers) provide enough energy for this mechanism to occur. An example of photoablation is vision correction surgery.
This occurs when tissue is heated very rapidly. Rapid thermal expansion and vaporisation of liquid leads to mechanical shock waves. Cells rupture explosively.
For ultrashort pulses, a very high temperature plasma may also be formed. This leads to shockwave generation & ablation (a process called photodisruption). Examples of thermomechanical effects include kidney stone removal and removal of fibrous tissue growth which can form after cataract surgery.
The eye is the most vulnerable to laser hazards. Injuries can occur at much lower power levels than for the skin and are typically more serious than skin effects:
The lens the pre-dominant absorbed of UV-A although a small amount is absorbed by the cornea. The effectiveness of UV to induce photochemical damage decreases with increasing wavelength. Thermal damage is the main concern here.
UV-B light penetrates deeper into the eye and both the cornea and the lens are at risk. Levels encountered in accidental laser exposure are typically well above the threshold causing permanent damage to the lens.
The absorption depth is very shallow and all light is absorbed in the surface of the cornea. Exposures above the threshold for damage for short pulses can result in ablation of the cornea .i.e. Excimer lasers.
If the peak irradiance is not high enough for photoablation, inflammation can occur. The injury can take take several hours to develop.
Between 400 nm and 1400 nm wavelengths, the retina is at risk. Transmission is higher in young persons (~380 nm) compared to adults. Concern from widespread use of LEDs emitting in the near UV range. Retinal damage will be permanent.
Near IR is transmitted to the retina. Mid-range IR affects the cornea and penetrates the aqueous humour. The far IR is absorbed by the cornea.
The cornea is damaged at an irradiance level lower than that necessary to acutely affect the lens. Below 1400nm, injuries can be superficial and will heal within a couple of days. Above 1400nm injuries will be deeper and permanent (well above threshold)
Eye Protection is required to all lasers of class 3R and above.
Risk of skin injury is secondary to eye damage. Skin injuries are not as significant and will usually heal, even after penetrating damage that may lead to infections. Damage to the skin may be thermal or photochemical, known simply as a ‘burn’ or a ‘sunburn’. Burn generally means a thermal injury. Sunburn generally means a photochemically induced erythema. Effects on the skin will depend on:
Skin Injuries can vary greatly in severity with a severe thermal injuries possibly damaging the underlying muscle and major blood vessels.
Not direct hazards from laser light but the hazards from the equipment that create it, and these include:
Learning Objectives
- Cancer Basics
- Fractionation
- The use of photons in radiotherapy
- Special techniques in radiotherapy
- Role of physicists in radiotherapy
Radiotherapy is the treatment of cancer with ionising radiation.
The abnormal, uncontrolled growth of cells that ultimately forms a tumour. As the tumour grows, some abnormal cells can break off and spread via the blood and lymph system to other parts of the body. This is known as a metastatic spread.
Cancer is initiated by a genetic mutation that affects the cell growth mechanism. Internal or external agents can promote the growth of that particular cancer. Cancer then progresses and becomes more aggresive
Treatments for cancer can include surgery, chemotherapy, hormone therapy, immunotherapy and radiotherapy.
Chemotherapy is where drugs are used to kill rapidly dividing cells. However cancer cells are not the only cells which are quickly dividing, other cells such as Red and White Blood Cells are also killed during treatment. As a result this lowers the immune system of patients, making them prone to infections. Another side effect is hair loss.
Some cancer cells are hormone receptive (e.g. breast cancer). Drugs such as Tamoxifen can bind to these receptor sites on the cancer cells, preventing their further division.
Tumour cells bind to T-cells to deactivate them. Immunotherapy drugs specifically block tumour cells from deactivating the T-cells, so the T-cells will kill the cancer cell.
If an ionisation treatment is applied during mitosis (as the cell is dividing), this is the most effective phase in the cell cycle to damage the cell.
Cancer cells cope less with an increase in radiation dose than normal cells, as cancer cells are more often in metaphase.
This is a form of radiotherapy where multiple small doses of radiation are used at intervals to take advantage of the fact that normal cells recover faster (and are less damaged by radiation) than cancer cells.
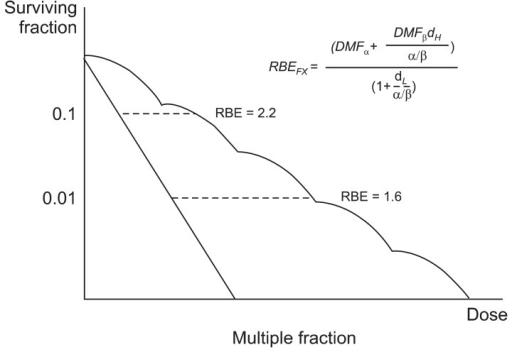
Fractionation has an enhanced effect on cancer cells. The common mode of delivery is around 30 fractions over 6 weeks. Hyperfractionation is an experimental technique using even more fractions.
A prescription is given in cGy (centiGray) which is related to former unit, rad (where 100 rad = 1 Gy). Usual doses are given in 10’s Gy in fractions of 1-2 Gy. Accuracy is critical (needs to be above 3%). A typical radiotherapy treatment could be 50 Gy.
X or gamma rays are predominantly used in radiotherapy. Their penetration increases with energy, and have interactions that include photoelectric absorption, compton scatter and pair production.
The ionisation is greatest not at the surface of the skin but at a slight depth. This slight depth is known as the build up. The higher the energy the longer it takes to ‘build up’ the number of electrons so the depth is deeper.
Is a large size motorised 3D water phantom for automatic dose distribution measurement of radiation therapy beams. Inside a plotting tank, there is an ionisation chamber to accurately measure the detection and measurement of certain types of ionising radiation; X-rays, gamma rays and beta particles.

A treatment is planned to maximise the dose to the tumour and minimise the dose to the surrounding tissue. The parameters than a radiotherapist can change is the penetration, the number of fields, the field size and the field shape. It is usually computerised.
In order to plan a treatment, imaging is often used to locate the tumour. Tumour localisation and beam positioning can be found using a CT simulator. Fluoroscopy and beam positioning can be used to stimulate a treatment.
This is an unsatisfactory treatment plan, as there is a dose gradient across a tumour, and a higher dose is given to the normal tissue above it.
This is a more accurate, where the same field is given from both sides. However again it is not sufficient to provide a cure because it causes too much damage to normal tissue. It is used almost always in palliative treatment.
With more beams, the treatment begins to become more accurate and effective than the single/parallel field treatments. However there are still come complexities with treatment. For example, the rectum is next to the prostate, but it is extremely sensitive to radiation. So to avoid any unwanted effects the beam is modified using:
Treatment can be delivered using a variety of techniques:
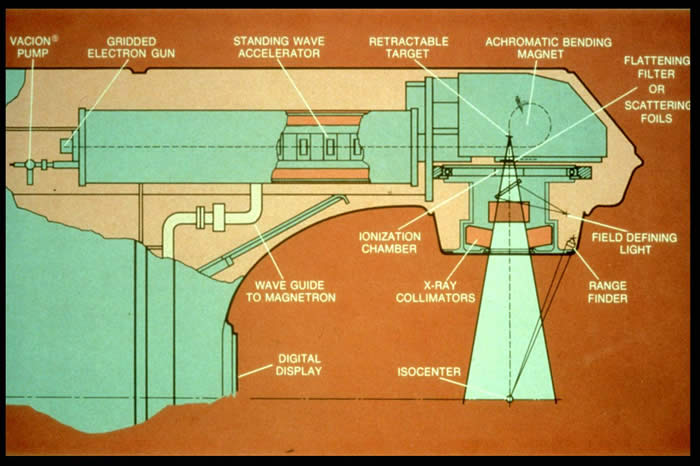
Patient set-up is crucial, with alignment as simulated. Patient’s are often given skin tattoo’s to align them with a laser as accurately as on the simulator. A cast is used for head and neck to prevent the patient from moving. The latest systems are even synchronised to breathing.
This is imaging during therapy. The alignment of the beam is confirmed with the tumour site. This allows modifications to the position etc. on the fly if the tumour volume changes during treatment.
This involves treating irregular shaped tumours. Detailed planning is required. It uses a multileaf and dynamic collimator, which aids in beam shaping/accuracy. Tomotherapy scans a tumour while it is being treated by radiotherapy.
This is used to combat brain tumour. It consists of multiple small beams (60+). Complex planning is involved.
TBI is used in leukaemia treatment. It destroys malignant bone arrow, which is replaced by a transplant of matched donor marrow. The set up is designed for uniform irradiation, lung dose is critical (10 Gy dose).
External beam radiotherapy (EBRT) or teletherapy is the most common form of radiotherapy (radiation therapy). The patient sits or lies on a couch and an external source of ionizing radiation is pointed at a particular part of the body.
Brachytherapy is a form of radiotherapy where a sealed radiation source is placed inside or next to the area requiring treatment. Brachytherapy is commonly used as an effective treatment for cervical, prostate, breast, and skin cancer and can also be used to treat tumours in many other body sites.
Physicists are heavily involved in treatment planning, identify problems and providing solutions. During treatment planning they lease with the oncologist and determine the best ‘set-up’. Physicists calculate the point dose and discuss this with the oncologist.
They look at the beam output, field uniformity, beam alignment (radiation/light), interlocks (doors, wedges etc). They measure all field sizes to ensure beam data is correct, beam outputs (all energies, photons and electrons) and other safety features. This process can take months.
Physicists are also commissioned for room design and protection. For example in a radiotherapy bunker, shielding, scattering and safety features all have to be calculated.